

The latest issue of the NFIB Small Business Economic Trends came out this morning. The headline number for November came in at 98.4, up 0.2 from the previous month. The index is at the 39th percentile in this series.
Here is an excerpt from the opening summary of the news release.
“As the end of the year nears, the outlook for business conditions is not encouraging to small business owners as lawmakers propose additional mandates and tax increases,” said NFIB Chief Economist Bill Dunkelberg. “Owners are also pessimistic as many continue managing challenges like rampant inflation and supply chain disruptions that are impacting their businesses right now.”
Key findings include:
- Owners expecting better business conditions over the next six months decreased one point to a net negative 38%, tied for the 48-year record low reading. This indicator has declined 18 points over the past four months to its lowest reading since November 2012.
- The net percent of owners raising selling prices increased six points to a net 59% (seasonally adjusted), the highest reading since October 1979.
- Seasonally adjusted, a net 54% of owners plan price hikes, up three points from October and a 48-year record high reading.
- Forty-eight percent of owners reported job openings that could not be filled, a decrease of one point from October.
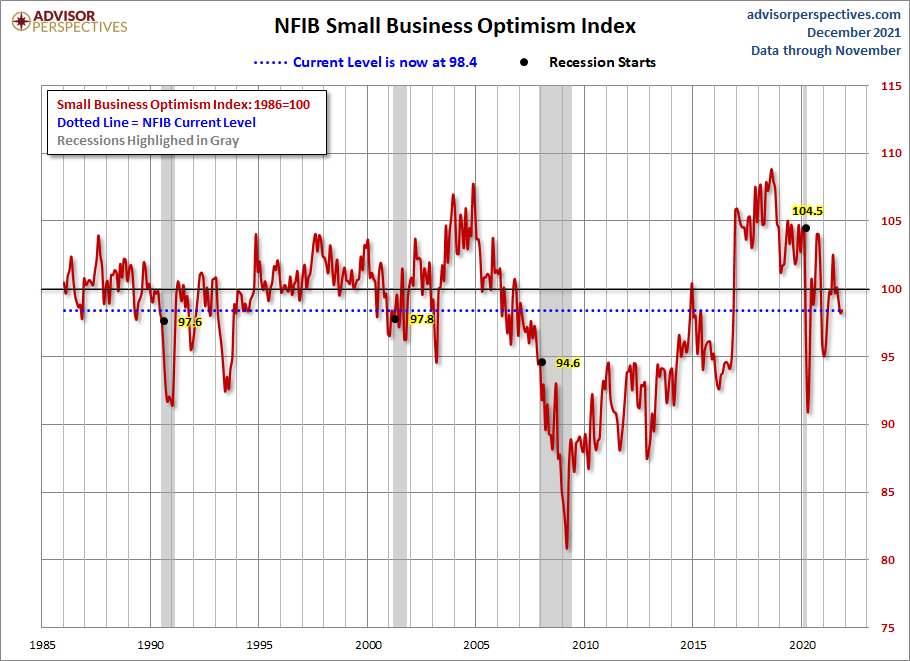
The first chart below highlights the 1986 baseline level of 100 and includes some labels to help us visualize that dramatic change in small-business sentiment that accompanied the Great Financial Crisis and now the COVID-19 pandemic. Compare, for example, the relative resilience of the index during the 2000-2003 collapse of the Tech Bubble with the far weaker readings following the Great Recession that ended in June 2009 and today's figures.
(Click on image to enlarge)
Here is a closer look at the indicator since the turn of the century.
(Click on image to enlarge)
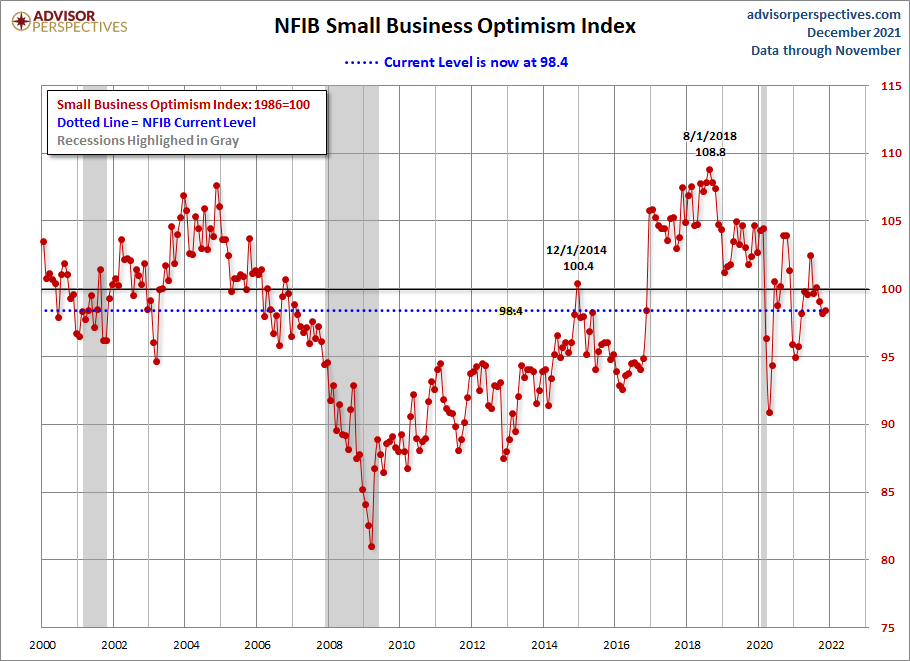
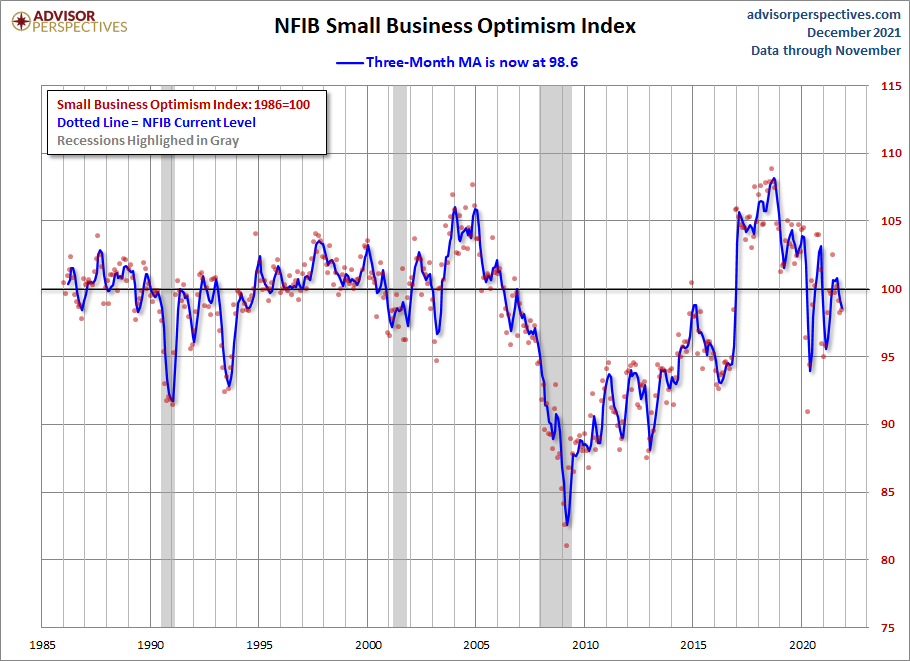
The average monthly change in this indicator is 1.4 points. To smooth out the noise of volatility, here is a 3-month moving average of the Optimism Index along with the monthly values, shown as dots.
(Click on image to enlarge)
Business Optimism and Consumer Confidence
The next chart is an overlay of the Business Optimism Index and the Conference Board Consumer Confidence Index. The consumer measure is the more volatile of the two, so it is plotted on a separate axis to give a better comparison of the two series from the common baseline of 100.
(Click on image to enlarge)
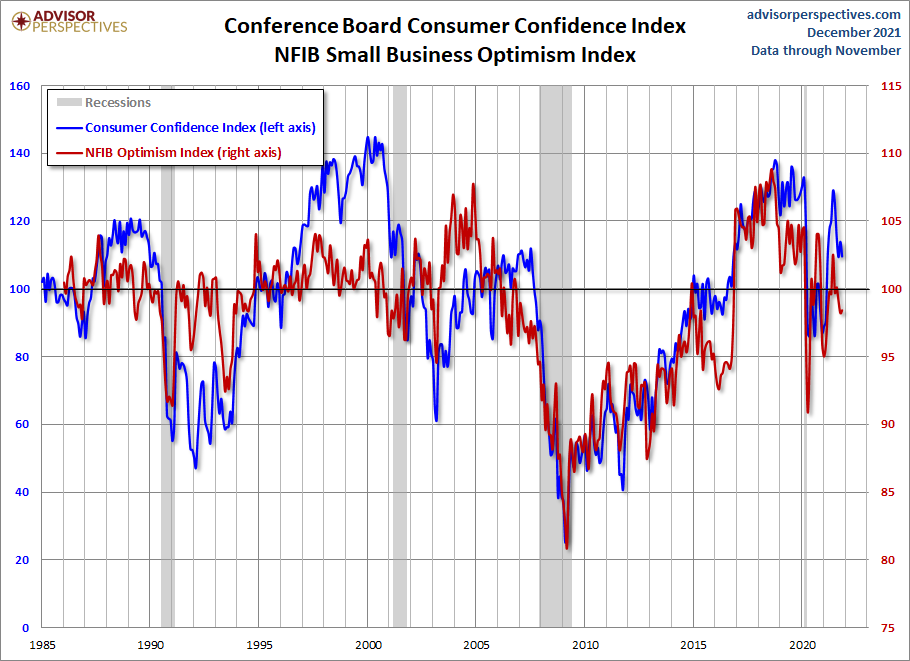
These two measures of mood have been highly correlated since the early days of the Great Recession. The two diverged after their previous interim peaks, but have recently resumed their correlation. A decline in Small Business Sentiment was a long leading indicator for the previous two recessions (but clearly not for the current recession).



Comments
Log in or sign up to join the conversation.