
Some readers will likely rejoice now that Rising Wedge no longer appears in the title since that risk quietly faded away like a passing shadow. The Market Review explains along with an updated chart showing a new upward sloping trendline.
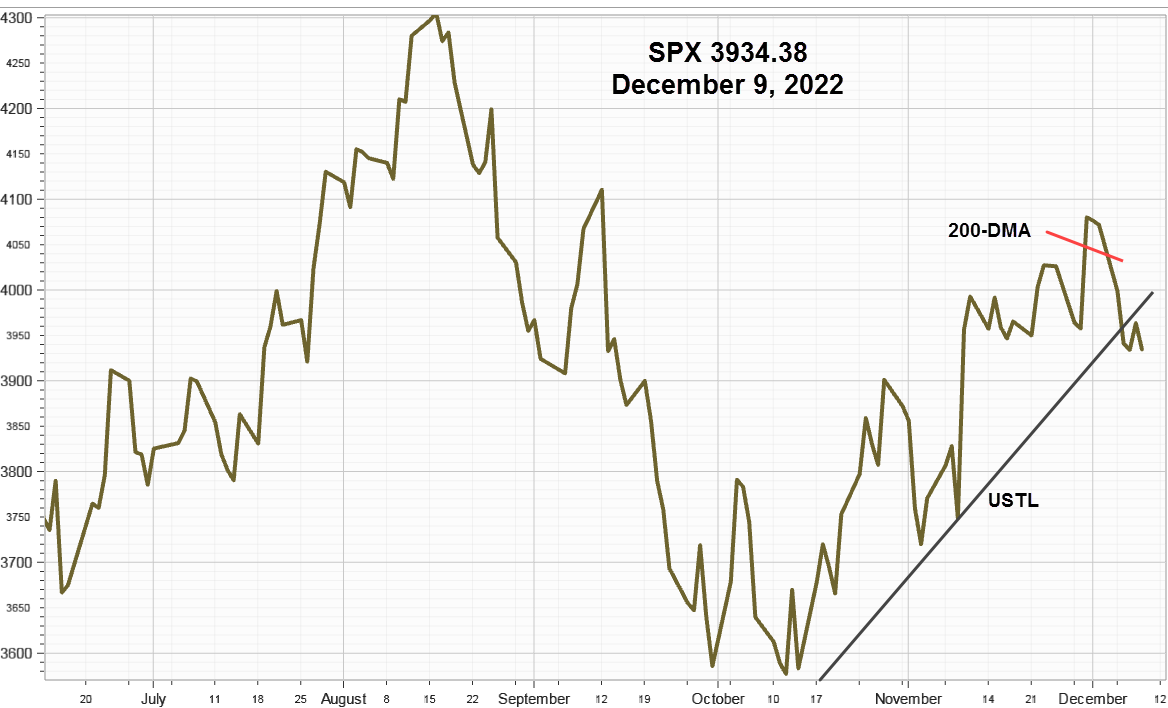
S&P 500 Index (SPX) 2929.80 added 99.09 points or +3.50% last week after turning higher last Monday ending the chance for the activation of a potential Rising Wedge. The updated chart below shows a new developing upward sloping trendline, USTL (without the upper and lower boundaries of the dismissed potential Rising Wedge.)
(Click on image to enlarge)

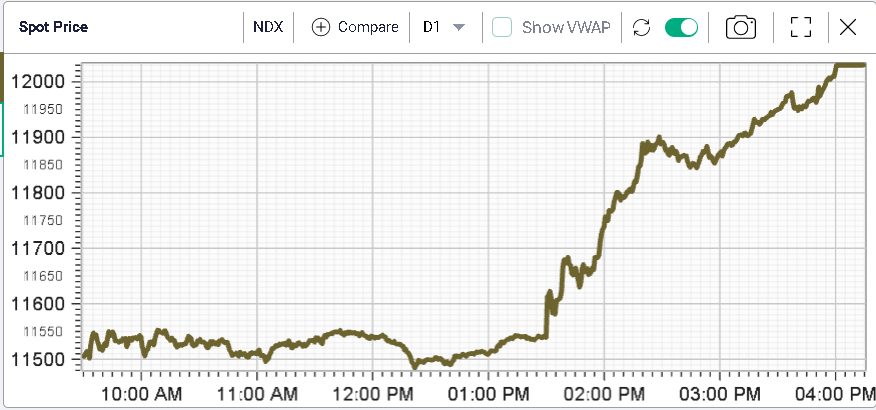
Included in the SPX, the large-capitalization Nasdaq stocks represented by the Invesco QQQ Trust (QQQ) 224.86, gapped open higher and closed above its 50-day Moving Average on April 14, shown on the SPX chart above. Then as momentum in this well- known large-capitalization ETF increased, the Energy sector joined in last week ending the Rising Wedge risk. Should it exceed the Fibonacci 62% retracement level at 2937, marked 62%, which seems likely, a new somewhat flatter upward sloping trendline will replace the one above.
CBOE Volatility Index® (VIX) 27.98 dropped 9.21 points or -24.76% last week. Our similar IVolatility Implied Volatility Index Mean, IVXM using four at-the-money options for each expiration period along with our proprietary technique that includes the delta and vega of each option, slipped 9.14 points or -28.44%, ending at 23.00%.
The spike up to 77.15% on Monday, March 16, the day SPX declined 324.89 points, will likely mark the top for this market decline. Despite job losses and demand destruction caused by COVID-19, the quick option implied volatility decline toward 20% reflects a sanguine view as restrictive measures ease.
(Click on image to enlarge)

VIX Futures Premium
This next chart shows as our calculation of Larry McMillan’s day-weighted average between the first and second-month futures contracts as of last Friday.
With 7 trading days until May expiration, the day-weighted premium between May and June allocated 28% to May and 72% to June for a premium of 8.35% % well into the yellow neutral zone between zero and 10%, moving toward the green zone above 10%, much improved vs. week ending May 1, at -1.39%.
The premium measures the amount that futures currently trade above or below the cash VIX, (contango or backwardation) until front month futures contract converges with the VIX at the next monthly futures expiration on Wednesday, May 20.
The relationship of the futures curve to the VIX, as measured by the premium, makes a good real-time sentiment indicator.
(Click on image to enlarge)

Put Volume Indicator
Another indicator confirming bullish improvement, the Cboe reports total put volume for the week declined 21%, to 10.29 million contracts from 13.09 million contracts for the week ending May 1. This chart shows daily total put volume from January peaking at 5.63 million contracts on February 28, with a second on March 9, at 5.45 million and the third on March 12, at 5.51 million contracts.
(Click on image to enlarge)

Summary
Last week, Invesco QQQ Trust (QQQ) and the Energy sector strength reduced the potential Rising Wedge risk to the S&P 500 Index as a new upward sloping trendline became the operative technical indicator accompanied by improving VIX futures and options conditions enough to consider the bear market ended last week without retesting the March 23 low.
Comments
Log in or sign up to join the conversation.