

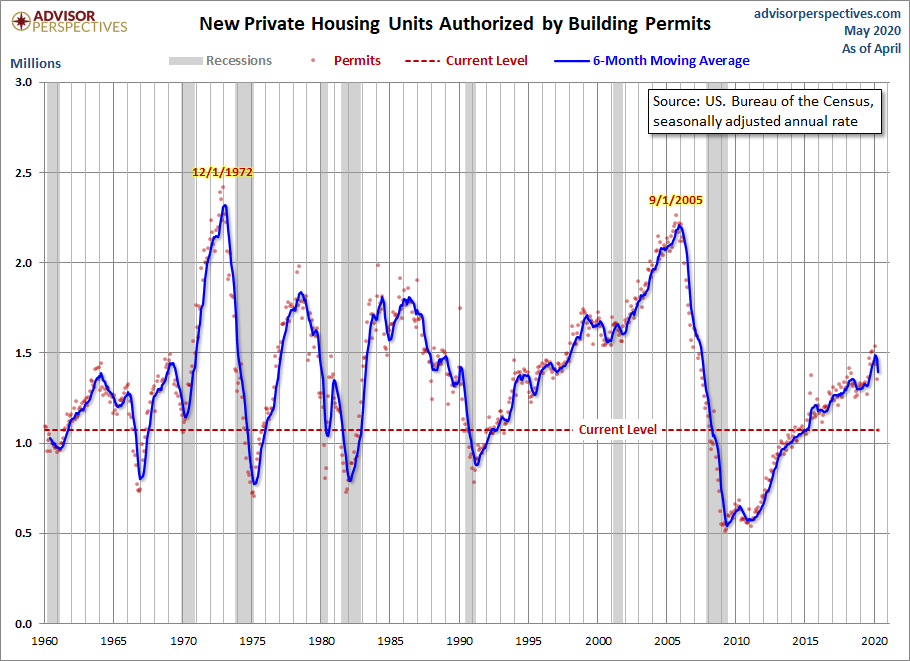
The U.S. Census Bureau and the Department of Housing and Urban Development have now published their findings for April new residential building permits. The latest reading of 1.074M was a decrease from 1.356M in March and above the Investing.com forecast of 1.000M.
Here is the opening of this morning's monthly report, including a note regarding revisions:
Statement Regarding COVID‐19 Impact: Due to recent events surrounding COVID‐19, many governments and businesses are operating on a limited capacity or have ceased operations completely. The Census Bureau has monitored response and data quality and determined estimates in this release meet publication standards.
Notice of Revision: With this release, unadjusted estimates of housing units authorized by building permits for January through December 2019 have been revised. Also, seasonally adjusted estimates of housing units authorized by building permits have been revised back toJanuary 2014, and seasonally adjusted estimates of housing units authorized but not started, started, under construction, and completed have been revised back to January 2015. All revised estimates are available on our website
Building Permits
Privately-owned housing units authorized by building permits in April were at a seasonally adjusted annual rate of 1,074,000. This is 20.8 percent (±0.9 percent) below the revised March rate of 1,356,000 and is 19.2 percent (±0.9 percent) below the April 2019 rate of 1,330,000.Single-family authorizations in April were at a rate of 669,000; this is 24.3 percent (±1.6 percent) below the revised March figure of 884,000. Authorizations of units in buildings with five units or more were at a rate of 373,000 in April. [link to report]
Here is the complete historical series, which dates from 1960. Because of the extreme volatility of the monthly data points, a 6-month moving average has been included.
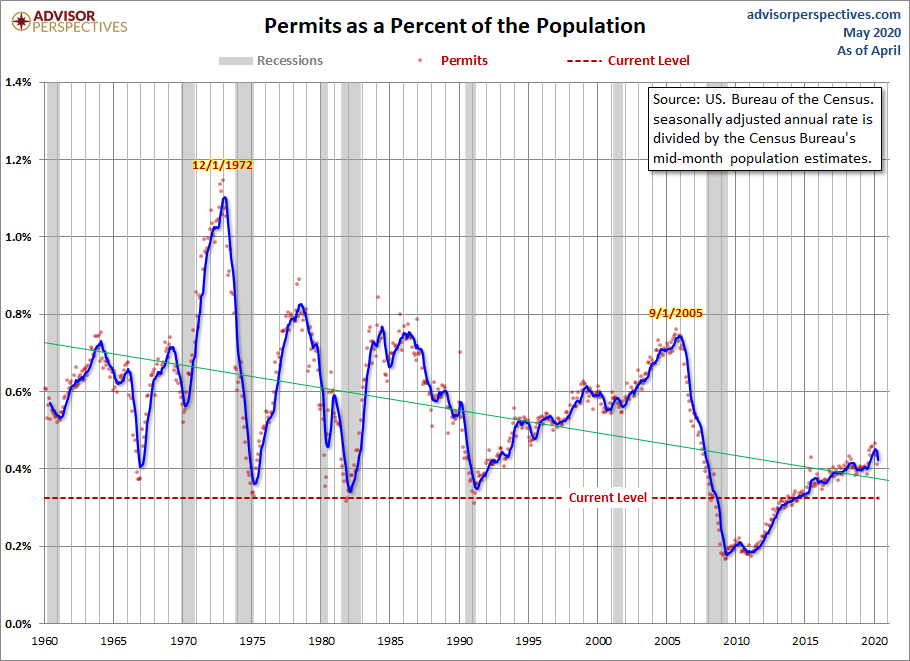
Here is the data with a simple population adjustment. The Census Bureau's mid-month population estimates show substantial growth in the US population since 1960. Here is a chart of housing starts as a percent of the population. We've added a linear regression through the monthly data to highlight the trend.
A Footnote on Volatility
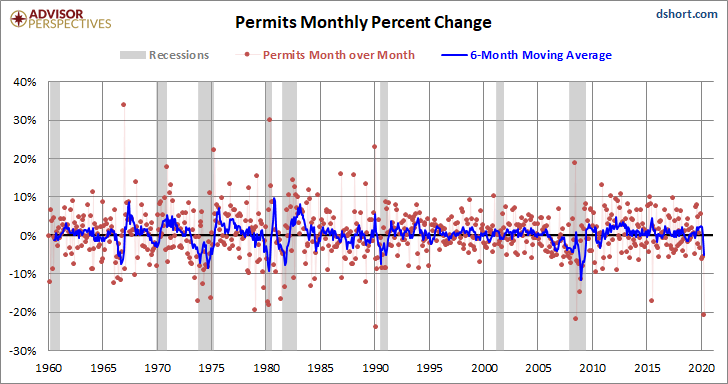
The extreme volatility of this monthly indicator is the rationale for paying more attention to its 6-month moving average than to its noisy monthly change. Over the complete data series, the absolute MoM average percent change is 4.4%. The MoM range minimum is -24.0% and the maximum is 33.9%.
For visual confirmation of the volatility, here is a snapshot of the monthly percent change since 1990.



Comments
Log in or sign up to join the conversation.