

What will next week bring us? Hopefully, another profitable trade! The entry has been triggered, and we are on track to reaching our first target.
Photo by American Public Power Association on Unsplash
The fundamental question is: are we witnessing a resumption of bullish factors on natural gas?
The price of gas hit its highest level since February 2014 in early October. Tight supplies and concerns about a rougher than expected winter in the northern hemisphere were the main propellants for natural gas. However, quite suddenly, a dip took place over the past week. Since exiting the key $ 5.00 per million British thermal units (MBtu) support zone a week ago, it has fallen by more than 25% – more than 40% drop from its highest level in October.
Meanwhile, at the pre-open last Monday, I told our members to get ready to go long around the $3.604-3.716 support zone (yellow band), with a stop placed just below the $3.424 level (red dotted line) and targets at $4.009 and $4.355 (green dotted lines).
As a result, gas prices contracted in stride while trading just into the provided entry area before the bull crowd woke up to push them back up in the following days.
In fact, with gas prices picking up momentum from Wednesday, the proposed trade entry on the Henry Hub futures is turning profitable (and getting closer to target #1).
Trading Charts
(Click on image to enlarge)
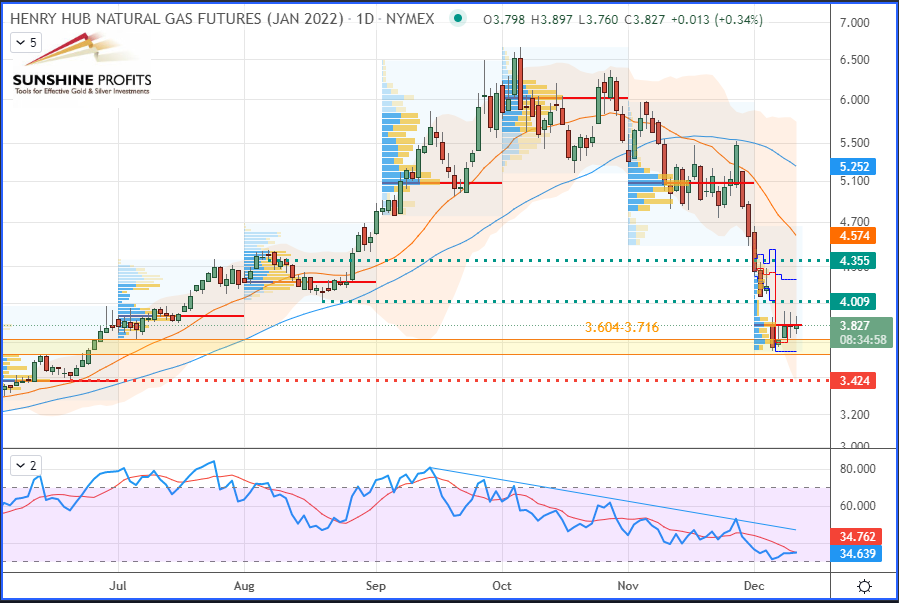
Chart – Henry Hub Natural Gas (NGF22) Futures (January contract, daily chart, logarithmic scale)
Now, let’s zoom into the 4H chart to observe the recent price action all around the abovementioned levels of our trade plan:
(Click on image to enlarge)
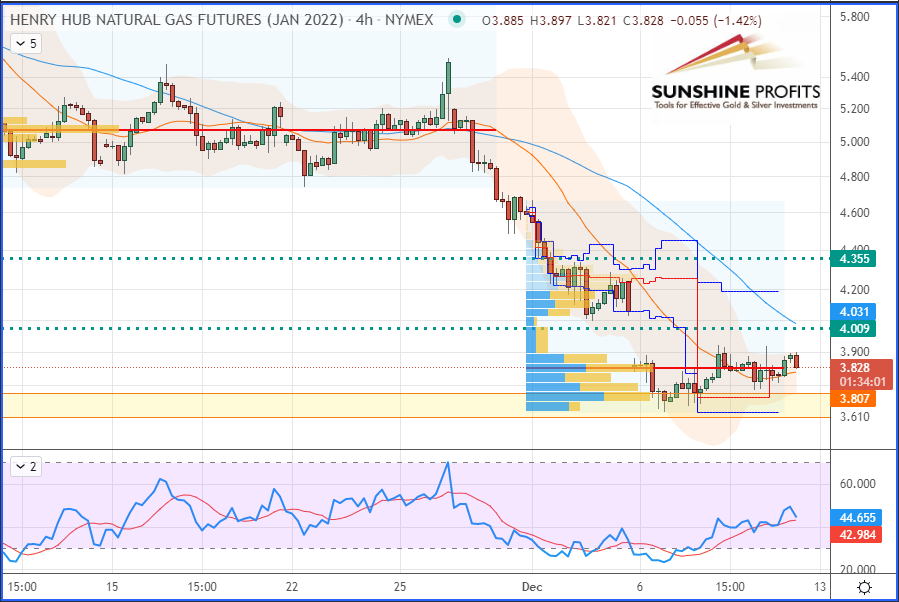
Chart – Henry Hub Natural Gas (NGF22) Futures (January contract, 4H chart, logarithmic scale)
In summary, my trading approach has led me to suggest some long trades around potential key supports, as this dip on natural gas offered a great opportunity for the bulls to enter long whilst aiming towards specific projected targets.



Comments
Log in or sign up to join the conversation.