

This morning's release of the June New Home Sales from the Census Bureau came in at 676K, down 6.6% month-over-month from a revised 724K in May. The Investing.com forecast was for 800K. The median home price is now at $361.8K.
Here is the opening from the report:
New Home Sales
Sales of new single‐family houses in June 2021 were at a seasonally adjusted annual rate of 676,000, according to estimates released jointly today by the U.S. Census Bureau and the Department of Housing and Urban Development. This is 6.6 percent (±16.5 percent)* below the revised May rate of 724,000 and is 19.4 percent (±13.9 percent) below the June 2020 estimate of 839,000.
Sales Price
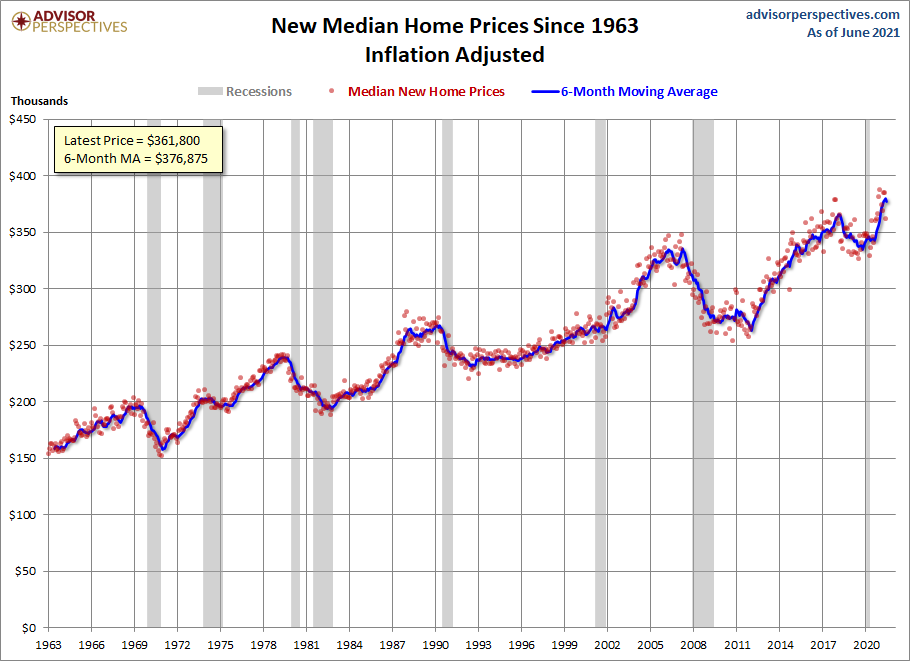
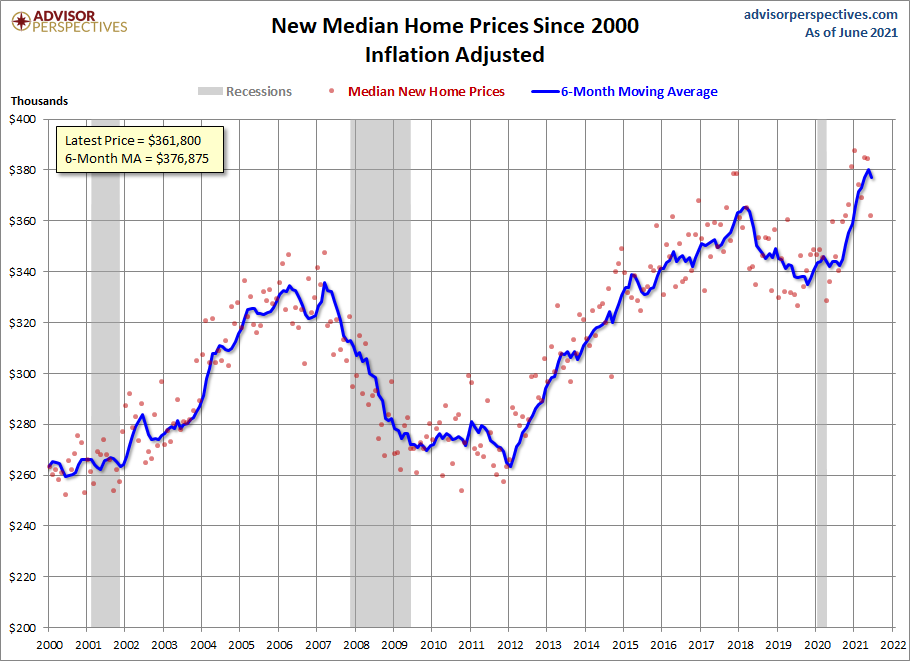
The median sales price of new houses sold in June 2021 was $361,800. The average sales price was $428,700. [Full Report]
For a longer-term perspective, here is a snapshot of the data series, which is produced in conjunction with the Department of Housing and Urban Development. The data since January 1963 is available in the St. Louis Fed's FRED repository here. We've included a six-month moving average to highlight the trend in this highly volatile series.
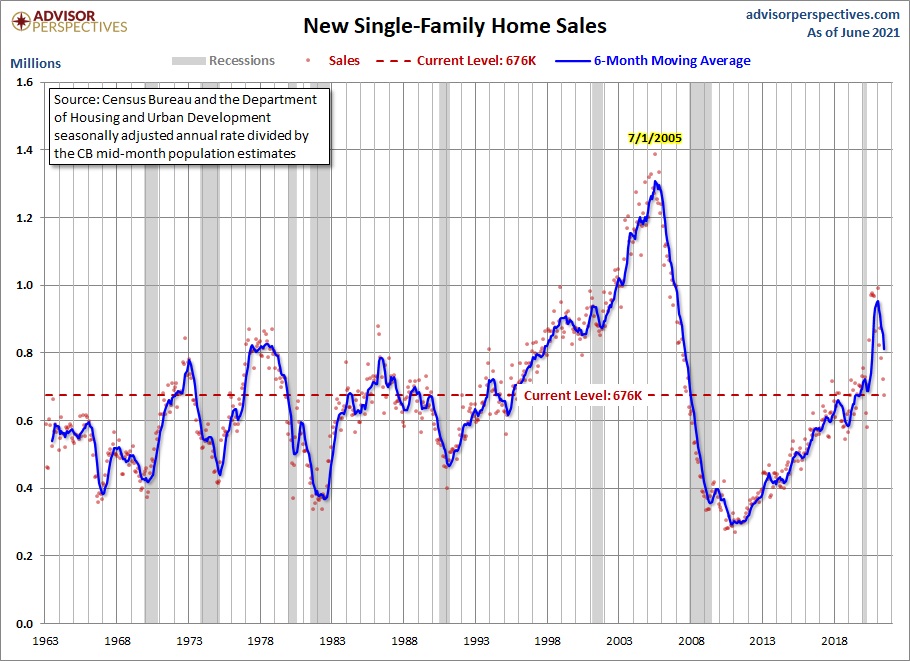
Over this time frame, we see the steady rise in new home sales following the 1990 recession and the acceleration in sales during the real estate bubble that peaked in 2005. Since 2011, we have seen a similar rise that has only recently retracted. We shall see if this retraction continues or is simply temporary.
The Population-Adjusted Reality
Now let's examine the data with a simple population adjustment. The Census Bureau's mid-month population estimates show a 76% increase in the US population since 1963. Here is a chart of new home sales as a percent of the population.
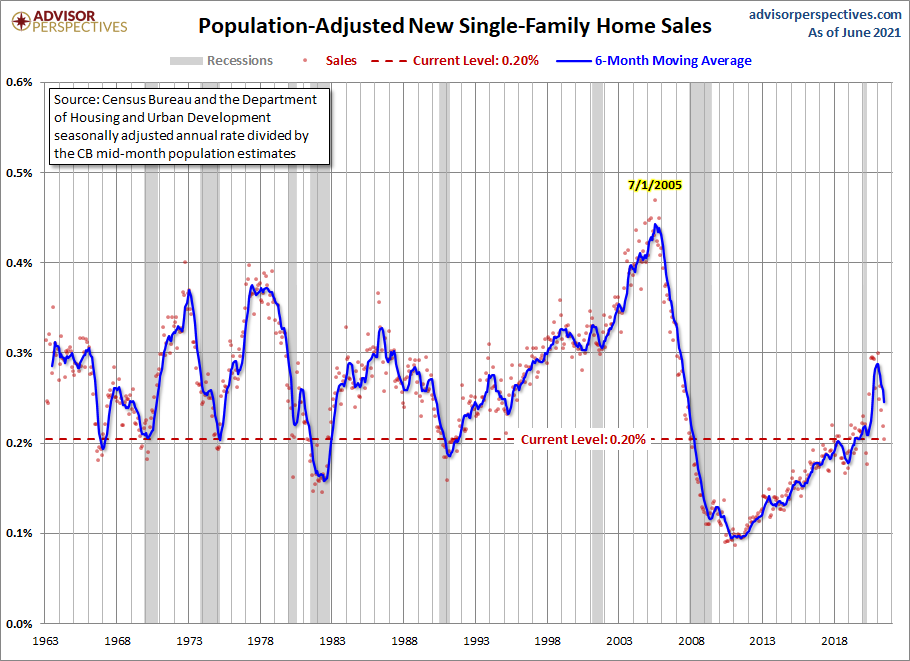
New single-family home sales are 14% above the 1963 start of this data series. The population-adjusted version is 35% below the first 1963 sales and at a level similar to the lows we saw during the Great Recession. Today's 30-year rate is 2.78%.
For another perspective, here is a chart of the median new home sale prices back to 1963, inflation-adjusted. The data source is also the Census Bureau and can be found on the press release and website above. For inflation adjustment, we use the CPI-U, which is the Consumer Price Index for All Urban Consumers. We've included a 6-month moving average for this extremely volatile metric to give us a clearer sense of the trend.
Here's a zoomed-in look since 2000.



Comments
Log in or sign up to join the conversation.