
It seems like almost every new data point on housing shows weakness. That’s because even though millennials are entering their prime age for home buying, starter homes have become unaffordable. Housing prices for houses less than 75% of the cost of median houses increased 8.9% from September 2016 to September 2017 which was above the 6.4% increase for all homes. Millennials are delaying home buying which is also delaying peak demand. The most common age is 27 in 2018. Millennials waiting until their early 30s to buy a house pushes off this demand. Even though the labor market is extremely robust as weekly wage growth is at a cycle high and the underemployment rate is at a cycle low, shelter inflation outperforming overall CPI has taken a toll on affordability.
The weekly MBA mortgage applications report showed the composite index fell 4% week over week in the week of November 2nd. That’s after it fell 2.5% in the previous week. The purchase index fell 5.0% after falling 2%. On an unadjusted basis the purchase index is 0.2% below where it was last year and is at the lowest level since November 2016. Rising interest rates and expensive housing are turning this quickly into a buyer’s market. The refinancing index fell 3% after falling 4% in the previous week. Refinancing fell to 39.1% of the mortgage market which makes sense because rates are rising. 30-year rates for mortgages less than $453,100 were up 4 basis points to 5.15% which is the highest rate since April 2010.
Housing Inventory Increases
As you can see from the chart below, the inventory of new unsold homes hit 7.1 months which is the first time it hit 7 months since 2011.
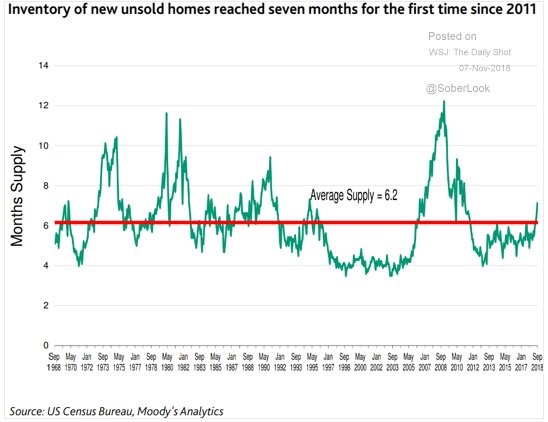
Source: Moody’s Analytics
Back in 2011, the housing market was recovering from the housing crisis, meaning inventory was falling. Inventory is a problem now because affordability is low and getting worse due to rising rates. In Seattle, which was one of the hottest real estate markets this cycle partially because it is where Amazon has its headquarters, sales fell 17.5% and the months of inventory increased from 1.2 to 2.4. That’s still far below the national average, but it signals the housing market is softening. Median home prices fell $25,000 to $750,000 in October in the past month. That’s down $80,000 from the record in the spring.
The housing market is a leading economic indicator. Therefore, it’s no surprise housing inventory leads GDP growth. As you can see from the chart below, since 1968, when new housing inventory has gotten to 7 months, GDP growth has gone negative.
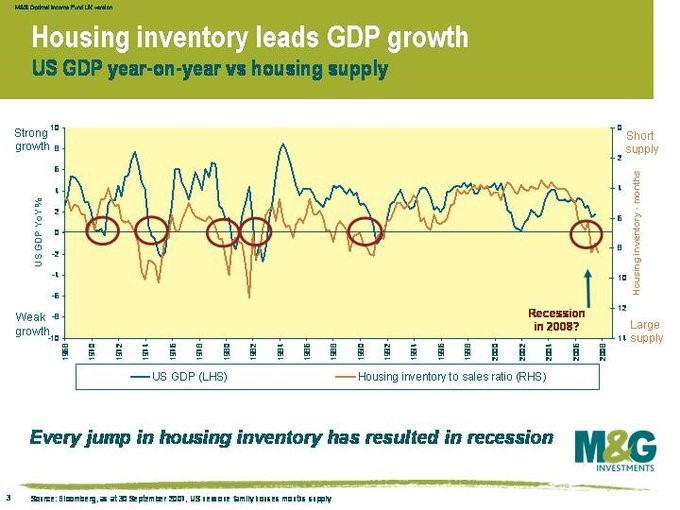
Source: M&G Investments
The chart was made in 2007 and was used to predict the recession in 2008. This seems to indicate there will be a recession in 2019 or 2020. The higher inventory gets, the better chance there will be a recession.
As you can see from the chart below, housing supply has flipped.
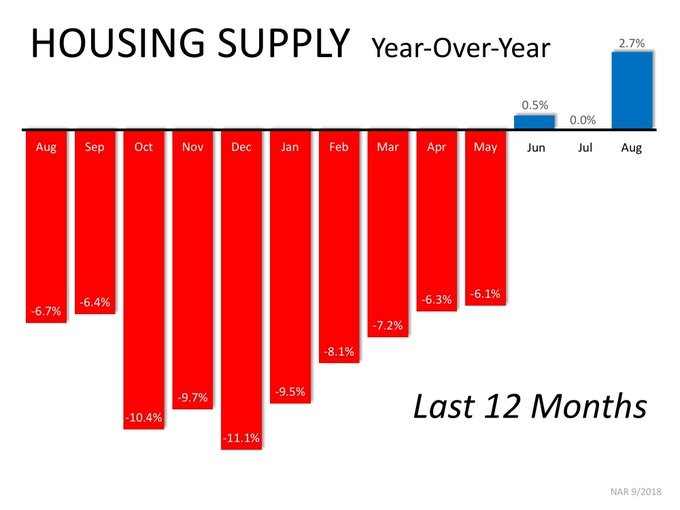
Source: Twitter @bryanclarksells
It was falling from August to May, but in June and August, it increased. The Fed appears to be ignoring the warnings signs the housing market is giving off as it is about to raise rates in December for the 4th time in 2018. It will be interesting to see if the Fed catches on to the weakness in housing in its next meetings or if it will whistle past the graveyard like it did in 2007.
Comments
Log in or sign up to join the conversation.