

As the main focus continues on business results in both the United States and Europe, during yesterday's session the market's attention was mostly focused on the Netflix (NFLX) results.
In April, these results were presented at the close of the market in which we could find a clear slowdown in the number of subscribers. On the other hand, during this second quarter we have been able to observe mixed results, since although revenues exceeded market expectations, earnings per share remained below expectations.
Specifically, Netflix earned earnings per share of $2.97 per share with quarterly revenue of $7,340 million versus $3.18 per share and expected revenue of $7.3 billion.
The decline in subscribers can be explained by the "exhaustion" of users, due to the strong competition that exists in this sector and the end of the pandemic restrictions that ranged from home confinements to night curfews. Despite this decline in subscribers, Netflix has achieved a net profit of $3.06 billion during the first half of the year.
On the other hand, Netflix has confirmed its expansion into the world of video games, so it hopes to increase its customer base and revenue through this market, where it could create its own games based on its own productions.
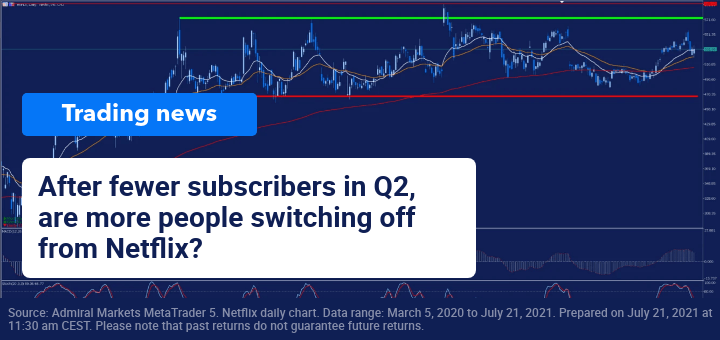
Technically speaking, if we look at the daily chart, we can see that over the last few months the price has moved in a wide side range of about $100 wide between the green and red bands that act as the main resistance and support levels respectively. Currently the price is in the middle zone of that channel after falling back to its moving average of 18 blank sessions.
(Click on image to enlarge)

Source: Admiral Markets MetaTrader 5
. Netflix daily chart. Data range: March 5, 2020 to July 21, 2021. Prepared on July 21, 2021 at 11:30 am CEST. Please note that past returns do not guarantee future returns.
Evolution of the last 5 years:
- 2020: 67.11%
- 2019: 20.89%
- 2018: 39.44%
- 2017: 55.06%
- 2016: 8.24%
If we look at the hourly chart, we can see that this support level on the daily chart corresponds to the coincident zone between the 38.2% and 50% Fibonacci retracement levels of the last up front and its 200-period moving average in the red so we can confirm it is an important support point.
(Click on image to enlarge)

Source: Admiral Markets MetaTrader 5
. Netflix hourly chart. Data range: March 1, 2021 to July 21, 2021. Prepared on July 21, 2021 at 11:40 a.m. CEST. Please note that past returns do not guarantee future returns.
In the first half of the year, Netflix has lost 2.32% and the loss of this support level, could cause a further correction in search of the next support levels around $510 per share, its moving average of 200 sessions red on the daily chart and $500 per share.
On the contrary, if the price manages to maintain this support level, we could find ourselves with new bullish momentum, although as we can see in the daily chart, it must face several resistance levels before reaching the upper band of the side channel.



Comments
Log in or sign up to join the conversation.