


Image Source: Conny Schneider on Unsplash
If you’ve been following the AI boom, you may know that the big hyperscalers (AWS, Azure, Google Cloud) can’t keep up. That’s exactly where the Neocloud comes into play. Nebius Group NV is the standout, writes Danielle Shay, editor of Five Star Trader.
Demand for raw GPU compute and the infrastructure required to run high-level AI models is expanding exponentially as more companies and individuals adopt AI. Multiple large companies have already come out this year and stated that they are using advanced generative AI rather than hiring more workers. In some cases, they are also cutting thousands of workers.
This is only the beginning of larger AI adoption. Usage will continue to explode across a variety of use cases, from complex agentic AI large language models capable of high-level reasoning and coding to robots like Optimus and autonomous cars already available in cities like Austin and Las Vegas.
Nebius Group NV Stock Chart
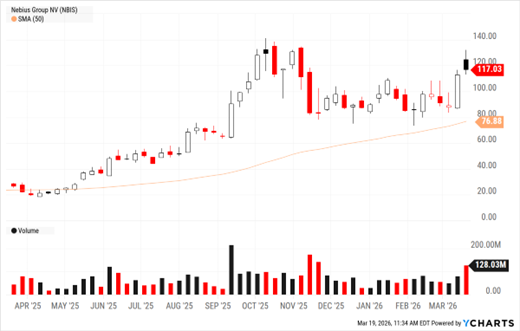
Data by YCharts
Neoclouds are companies that build and run data centers packed with thousands of the world’s most powerful AI chips – mostly Nvidia Corp. GPUs. Their only business is renting time on those chips to AI companies so they can train and run massive models. They don’t offer websites, storage, or email like the old clouds did.
Nebius was spun out of Yandex with elite engineers and $2.5 billion in cash. It’s already sold out for Q1 and has a $17 billion-plus Microsoft Corp. deal locked. It’s Wall Street’s favorite “CoreWeave 2.0 with a tech edge.”
I will continue trading names like Nebius Group on a short-term basis, especially when they break out above previous highs and short squeeze. I’ll hold them on a long-term basis unless they break critical support and something fundamental changes. For example, I use the 50-SMA on the weekly chart as a key technical stop-loss zone.
About the Author
Danielle Shay is a market analyst, trader, and the VP of options at Simpler Trading. She is an expert commentator on CNBC's Trading Nation, Fox News, Fox Business, Yahoo! Finance, Cheddar, Stockcharts.com, and more.
Ms. Shay is also a contributing author in John Carter's 3rd edition of Mastering the Trade. Her focus is on trend-following and directional strategies via options trading, though she covers stocks and ETFs as well. As a former teacher, Ms. Shay's goal is to help traders grasp the basics that make trading simpler-no matter their skill level. Her motto is, "If I can do it, you can do it."



Comments
Log in or sign up to join the conversation.