


Natural gas is staging a recovery from its swing low near the $2.514 level, with price currently trading around $3.006 as it retests the broken long-term ascending trend line from below. This former support could now act as a ceiling, keeping sellers in control.
The Fibonacci retracement tool drawn from the $3.705 swing high to the $2.514 swing low highlights the levels where sellers could be lurking. The 38.2% Fib sits at $2.969, which price has already nudged past, while the 50% level at $3.110 lines up closely with the broken trend line and could reinforce resistance in that area.
A stronger bounce could reach the 61.8% Fib at $3.250, but that zone also converges with the 200 SMA, making it a formidable barrier for bulls to overcome.
If the broken trend line and Fibonacci levels hold as resistance, natural gas could roll over and revisit the $2.514 swing low or push even lower. A decisive close above the 61.8% Fib and 200 SMA, however, would put the $3.705 level back on the radar.
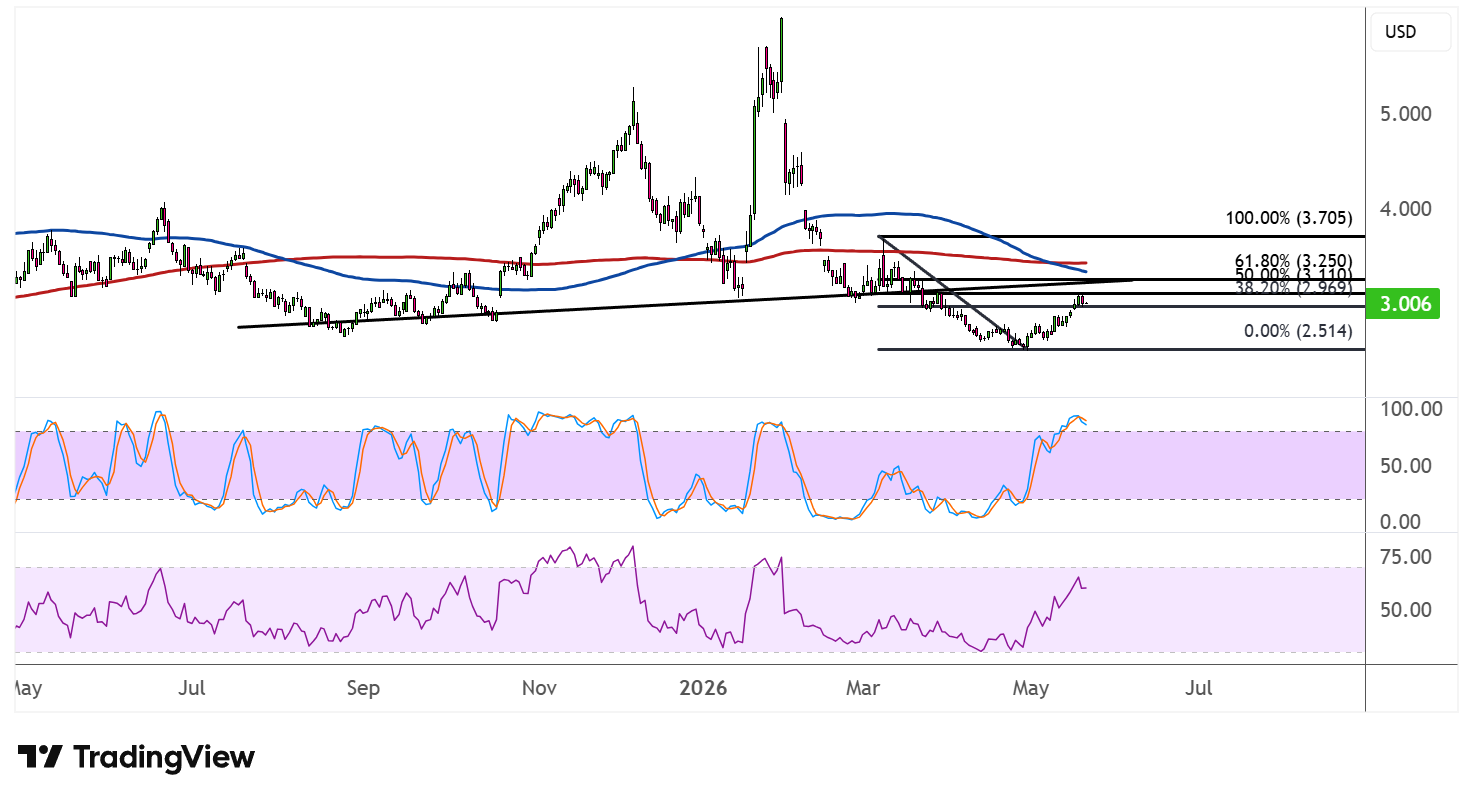
The 100 SMA remains below the 200 SMA, confirming that the path of least resistance is still to the downside. Both indicators are sloping lower, adding dynamic resistance overhead and suggesting the broader downtrend has not yet run its course.
Stochastic is climbing sharply toward the overbought zone, reflecting a burst of bullish momentum in the near term. However, once the oscillator reaches that ceiling and turns lower, it could signal a fresh wave of selling pressure, potentially rejecting price right at the Fib levels.
RSI is also pushing higher and approaching the upper end of its recent range, leaving limited room for additional upside before buyers start to tire.
Natural gas has been steadily climbing but is not out of the woods yet, as improvements in the geopolitical landscape boosting supply expectations and seasonal factors weighing on the consumption outlook could combine forces to weigh on the energy commodity.



Comments
Log in or sign up to join the conversation.