


Image Source: Unsplash
It’s been a rough go for Natural Gas prices.
Even with elevated inflation numbers, Natural Gas is still in crash mode.
“The facts, Ma’am. Just the facts.” – Joe Friday
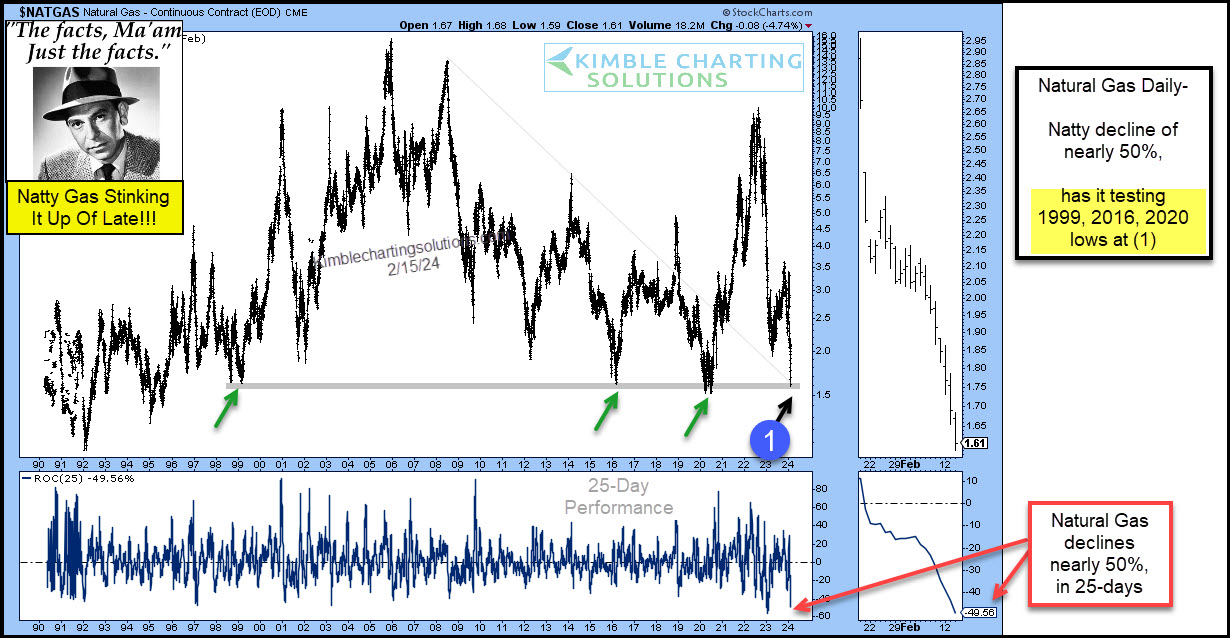
Today’s Natural Gas chart highlights the crash in Natural Gas prices. Natty has fallen nearly 50 percent in just 25 days!!
That is the 2nd largest 25-day decline in Natural Gas history.
And it is currently testing important lows, a support area that dates back 25-years (1999) at (1).
In my humble opinion, this is a critically important support test following a rare decline. Will Natural Gas bulls show up here?
(Click on image to enlarge)
More By This Author:
Is Cisco About To Lose Leadership Position?
Treasury Bond Yields Reverse Higher Off Key Fibonacci Level
Bullish Message For Gold Investors… Only If This Ratio Breaks Out



Comments
Log in or sign up to join the conversation.