

(Click on image to enlarge)
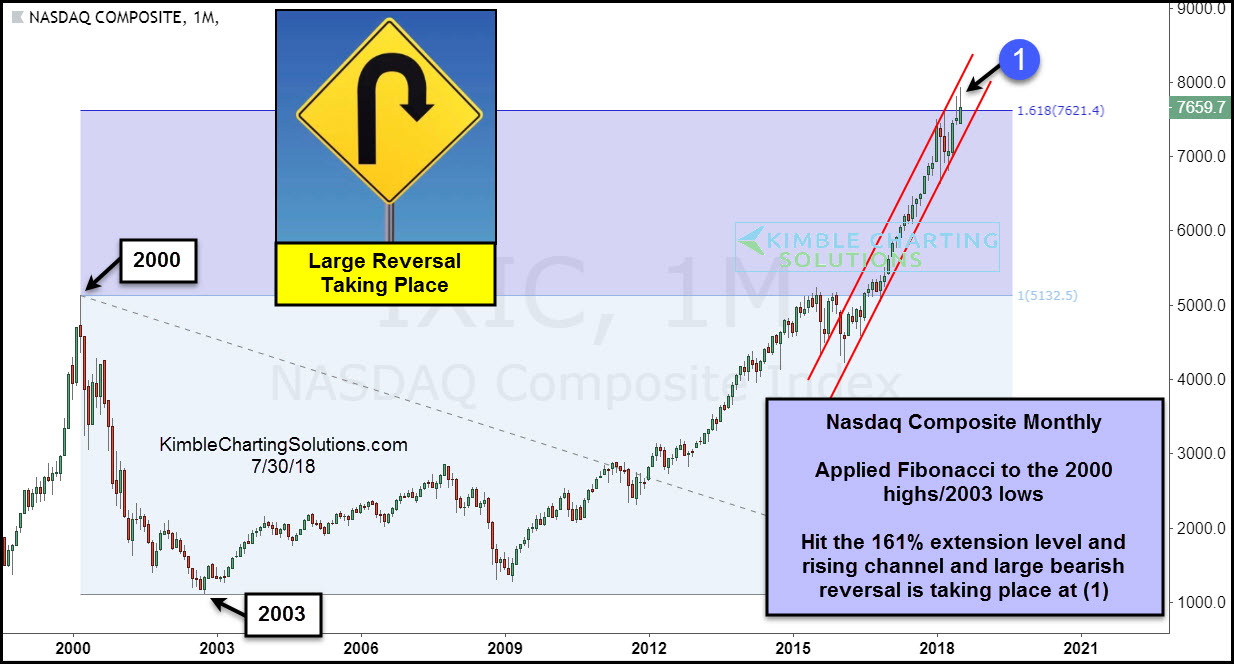
This chart looks at the Nasdaq Composite Index on a monthly basis over the past 20-years, where we applied Fibonacci to the 2000 highs and the 2003 lows.
This past month the index was testing the 161% Fibonacci extension level off the 2000 highs/2003 lows and the underside of a steep rising channel at (1).
While testing both of these levels this month, the index looks to be creating a large bearish reversal pattern (bearish wick) at dual resistance.
The trend for tech remains up. This is a price point that bulls do not want to see selling get started.



Comments
Log in or sign up to join the conversation.