


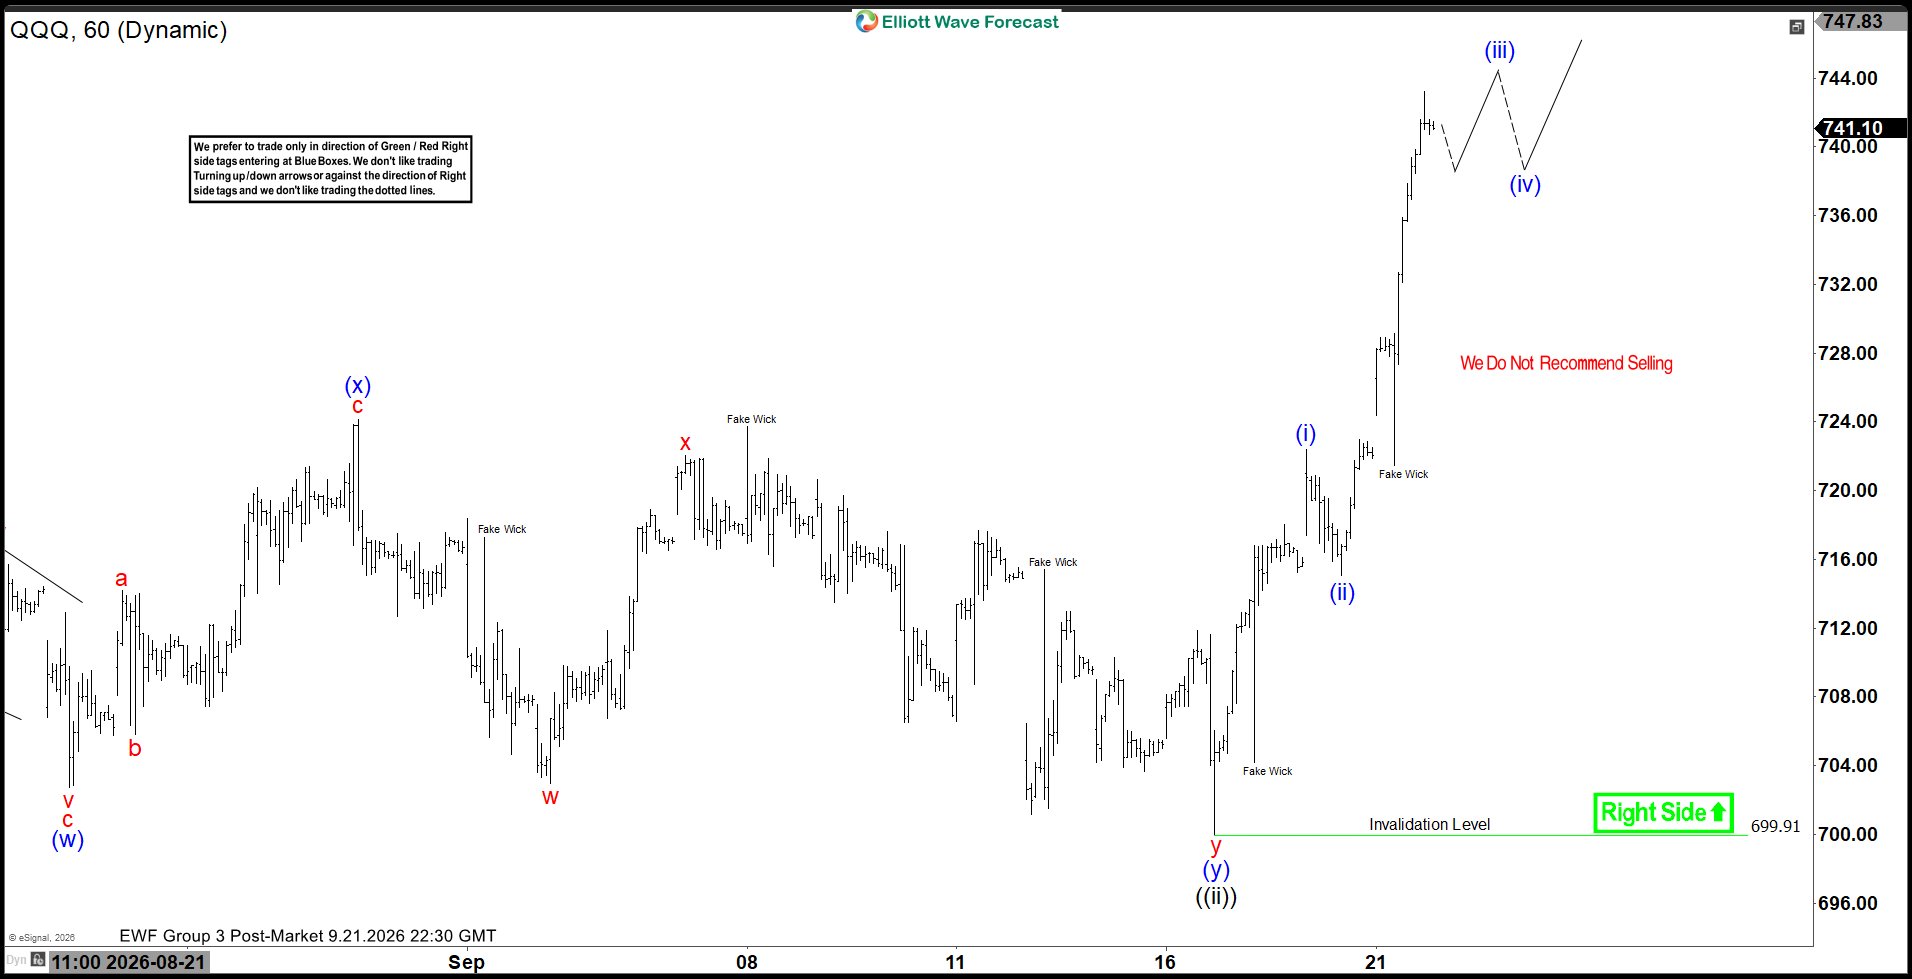
The short‑term Elliott Wave view indicates that the Nasdaq 100 ETF (QQQ) is positioned to break toward a new all‑time high. The rally from the July 29, 2026 low has unfolded as a five‑wave structure. Within this advance, wave ((i)) terminated at $734.58. The subsequent pullback in wave ((ii)) developed as a double three corrective pattern. From wave ((i)), wave (w) ended at $702.70, followed by wave (x) at $724.13. The decline in wave (y) concluded at $699.91, thereby completing wave ((ii)) at a higher degree.
Following this correction, the ETF resumed its upward trajectory in wave ((iii)), which is progressing with internal subdivision into five waves. From wave ((ii)), wave (i) ended at $722.39, while the pullback in wave (ii) reached $715.08. Near term, the pivot at $699.91 remains critical. As long as this level holds, dips are expected to attract buyers in either three or seven swings. The broader implication is that the ETF retains a constructive outlook, with the corrective phase already completed and momentum favoring further extension higher.
Nasdaq 100 ETF 60 Minute Elliott Wave Chart



Comments
Log in or sign up to join the conversation.