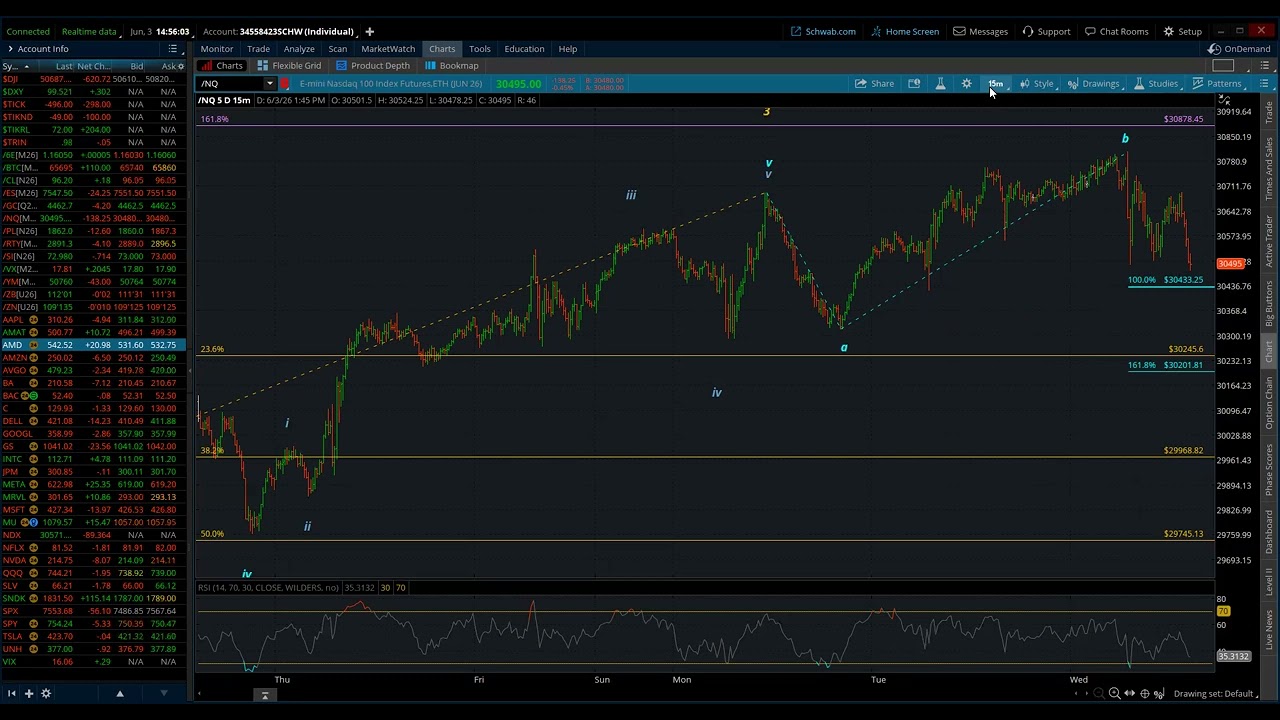
Nasdaq 100 Elliott Wave analysis reveals complex structures signaling market indecision since October. Key gamma levels at 600 will determine if the index makes a final bullish push or triggers a bearish diagonal reversal.
An Elliott Wave analysis of the Nasdaq-100 suggests the market is forming complex three-wave structures since October, indicating indecision. The analyst sees either a final bullish push via an ending diagonal or the start of a bearish diagonal, with key levels driven by gamma positioning around QQQ 600.
Video Length: 00:17:51
Disclaimer:
Futures and Options trading has large potential rewards, but also large potential risk. You must be aware of the risks and be willing to accept them in order to invest in the futures and options markets. Don’t trade with money you can’t afford to lose. This is neither a solicitation nor an offer to Buy/Sell futures or options. No representation is being made that any account will or is likely to achieve profits or losses similar to those discussed on this web site. The past performance of any trading system or methodology is not necessarily indicative of future results.
CFTC Rule 4.41 – Hypothetical or simulated performance results have certain limitations. Unlike an actual performance record, simulated results do not represent actual trading. Also, since the trades have not been executed, the results may have under-or-over compensated for the impact, if any, of certain market factors, such as lack of liquidity. Simulated trading programs in general are also subject to the fact that they are designed with the benefit of hindsight. No representation is being made that any account will, or is likely to, achieve profit or losses similar to those shown.


Comments
Log in or sign up to join the conversation.