

I am often asked if I utilize the methods I teach here on ModernGraham, and the answer is yes. I fully believe that Benjamin Graham’s methodology can be used in the market today, especially after taking time to analyze each one of his ideas and modernize it as needed. The ModernGraham method can be a great way to narrow down investment opportunities to the strongest companies, and then a little bit of further research can help one determine in which companies to invest.
This series of posts looks at each of my personal holdings, putting them through a full ModernGraham valuation and adding a level of further research to provide rationale as to why I selected the company for my portfolio. Here’s a page with more information about my portfolio, including my thoughts and goals on asset allocation and an overview of my current holdings.
The first step in my analysis is to put the company through a full ModernGraham valuation. For readers who may be new to the site, here on ModernGraham I cover the full S&P 500, putting each company through an individual valuation like this every quarter if it qualifies for either the Defensive Investor or Enterprising Investor, or every year if it does not qualify for either investor type.
ModernGraham Valuation
Benjamin Graham taught that Intelligent Investors must do a thorough fundamental analysis of investment opportunities to determine their intrinsic value and inherent risk. This is best done by utilizing a systematic approach to analysis that will provide investors with a sense of how a specific company compares to another company or by reviewing the 10 Most Undervalued Companies for the Defensive Investor – August 2015. By using the ModernGraham method one can review a company’s historical accomplishments and determine an intrinsic value that can be compared across industries. What follows is a stock analysis showing a specific look at how Apple Inc. (AAPL) fares in the ModernGraham valuation model.

Company Profile (obtained from Google Finance): Apple Inc. designs, manufactures and markets mobile communication and media devices, personal computers, and portable digital music players, and a variety of related software, services, peripherals, networking solutions, and third-party digital content and applications. The Company’s products and services include iPhone, iPad, Mac, iPod, Apple TV, a portfolio of consumer and professional software applications, the iOS and OS X operating systems, iCloud, and a variety of accessory, service and support offerings. The Company also delivers digital content and applications through the iTunes Store, App StoreSM, iBookstoreSM, and Mac App Store. The Company distributes its products worldwide through its retail stores, online stores, and direct sales force, as well as through third-party cellular network carriers, wholesalers, retailers, and value-added resellers. In February 2012, the Company acquired app-search engine Chomp.
Downloadable PDF version of this valuation:
ModernGraham Valuation of AAPL
Stage 1: Is this company suitable for the Defensive Investor or the Enterprising Investor?
What kind of Intelligent Investor are you?
| Defensive Investor; must pass 6 out of the following 7 tests. | |||
| 1. Adequate Size of the Enterprise | Market Cap > $2Bil | Pass | |
| 2. Sufficiently Strong Financial Condition | Current Ratio > 2 | Fail | |
| 3. Earnings Stability | Positive EPS for 10 years prior | Pass | |
| 4. Dividend Record | Dividend Payments for 10 years prior | Fail | |
| 5. Earnings Growth | Increase of 33% in EPS in past 10 years using 3 year averages at beginning and end | Pass | |
| 6. Moderate PEmg Ratio | PEmg < 20 | Pass | |
| 7. Moderate Price to Assets | PB Ratio < 2.5 OR PB*PEmg < 50 | Fail | |
| Score | |||
| Enterprising Investor; must pass 4 out of the following 5 tests, or be suitable for the Defensive Investor. | |||
| 1. Sufficiently Strong Financial Condition | Current Ratio > 1.5 | Fail | |
| 2. Sufficiently Strong Financial Condition | Debt to NCA < 1.1 | Fail | |
| 3. Earnings Stability | Positive EPS for 5 years prior | Pass | |
| 4. Dividend Record | Currently Pays Dividend | Pass | |
| 5. Earnings Growth | EPSmg greater than 5 years ago | Pass |
Stage 2: Determination of Intrinsic Value
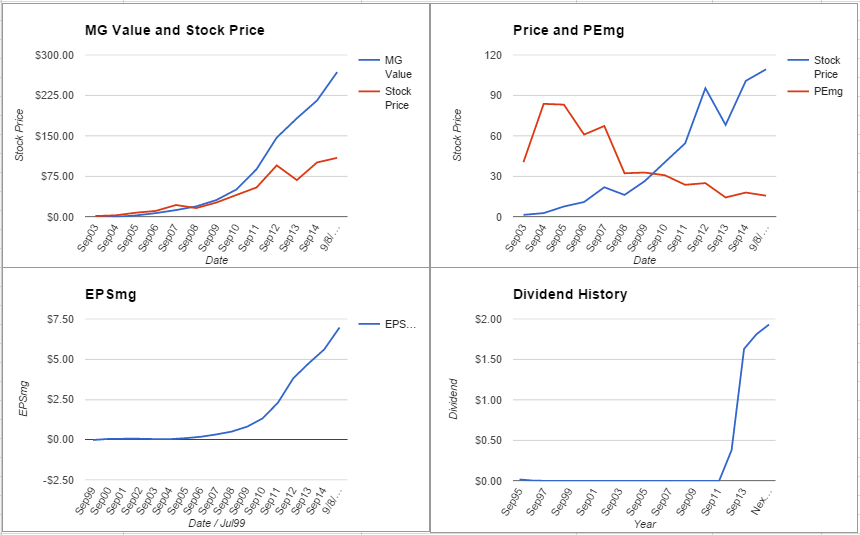
| EPSmg | $6.96 |
| MG Growth Estimate | 15.00% |
| MG Value | $268.10 |
| Opinion | Undervalued |
| MG Value based on 3% Growth | $100.97 |
| MG Value based on 0% Growth | $59.19 |
| Market Implied Growth Rate | 3.60% |
| Current Price | $109.27 |
| % of Intrinsic Value | 40.76% |
Apple Inc. does not qualify for either the Defensive Investor or the Enterprising Investor. The Defensive Investor is concerned with the low current ratio, short dividend history, and the high PB ratio. The Enterprising Investor is concerned about the level of debt relative to the net current assets. As a result, all value investors following the ModernGraham approach based on Benjamin Graham’s methods should explore other opportunities or proceed with a cautious speculative attitude.
As for a valuation, the company appears to be undervalued after growing its EPSmg (normalized earnings) from $2.29 in 2011 to an estimated $6.96 for 2015. This level of demonstrated earnings growth outpaces the market’s implied estimate of 3.6% annual earnings growth over the next 7-10 years. As a result, the ModernGraham valuation model, based on Benjamin Graham’s formula, returns an estimate of intrinsic value above the price.
The next part of the analysis is up to individual investors, and requires discussion of the company’s prospects.
Stage 3: Information for Further Research
| Net Current Asset Value (NCAV) | -$13.25 |
| Graham Number | $66.43 |
| PEmg | 15.69 |
| Current Ratio | 1.09 |
| PB Ratio | 5.02 |
| Dividend Yield | 1.77% |
| Number of Consecutive Years of Dividend Growth | 4 |
Useful Links:
| ModernGraham tagged articles | Morningstar |
| Google Finance | MSN Money |
| Yahoo Finance | Seeking Alpha |
| GuruFocus | SEC Filings |
Most Recent Balance Sheet Figures
| Total Current Assets | $70,953,000,000 |
| Total Current Liabilities | $65,285,000,000 |
| Long-Term Debt | $47,419,000,000 |
| Total Assets | $273,151,000,000 |
| Intangible Assets | $8,823,000,000 |
| Total Liabilities | $147,474,000,000 |
| Shares Outstanding (Diluted Average) | 5,773,099,000 |
Earnings Per Share History
| Next Fiscal Year Estimate | $9.01 |
| Sep14 | $6.45 |
| Sep13 | $5.68 |
| Sep12 | $6.31 |
| Sep11 | $3.95 |
| Sep10 | $2.16 |
| Sep09 | $1.30 |
| Sep08 | $0.77 |
| Sep07 | $0.56 |
| Sep06 | $0.32 |
| Sep05 | $0.22 |
| Sep04 | $0.05 |
| Sep03 | $0.01 |
| Sep02 | $0.01 |
| Sep01 | -$0.01 |
| Sep00 | $0.16 |
| Sep99 | $0.13 |
| Sep98 | $0.08 |
| Sep97 | -$0.30 |
| Sep96 | -$0.24 |
| Sep95 | $0.12 |
Earnings Per Share – ModernGraham History
| Next Fiscal Year Estimate | $6.96 |
| Sep14 | $5.60 |
| Sep13 | $4.74 |
| Sep12 | $3.81 |
| Sep11 | $2.29 |
| Sep10 | $1.32 |
| Sep09 | $0.81 |
| Sep08 | $0.50 |
| Sep07 | $0.33 |
| Sep06 | $0.18 |
| Sep05 | $0.09 |
| Sep04 | $0.03 |
| Sep03 | $0.04 |
| Sep02 | $0.06 |
| Sep01 | $0.06 |
| Sep00 | $0.05 |
| Sep99 | -$0.02 |
Comments
Log in or sign up to join the conversation.