
Today I used Barchart to sort the NASDAQ 100 Index stocks to find the stocks with the worst technical sell signals. You might note that just a few months ago most of these were on my list of Best NASDAQ 100 stocks. Just another reason why buy and hold should be a dead issue before you let the fickled finger of fate tank your portfolio.
The list includes:Keurig Green Mountain,Kla-Tencor,Alexion Pharmaceuticals,Fastenal and Microsoft:
Keurig Green Mountain (GMCR)
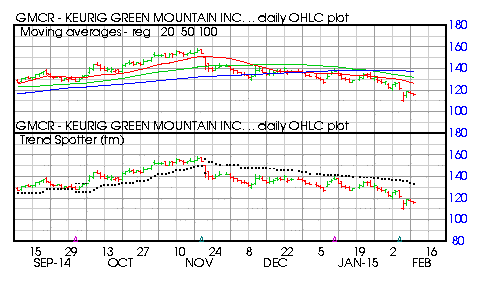
Barchart technical indicators:
- 96% Barchart technical sell signals
- Trend Spotter sell signals
- Below its 20, 50 and 100 day moving averages
- 26.65% off its recent high
- Relative Strength Index 34.17%
- Recently traded at 116.45 which is below its 50 day moving average of 131.88
Kla-Tencor (KLAC)
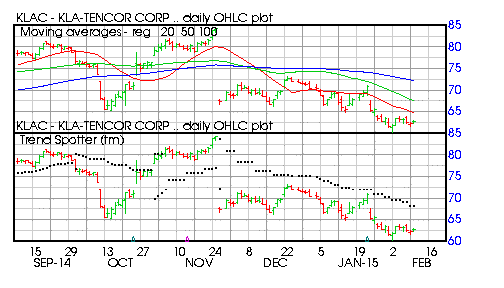
Barchart technical indicators:
- 88% Barchart technical sell signals
- Trend Spotter sell signal
- Below its 20, 50 and 100 day moving averages
- 25.52% off its recent high
- Relative Strength Index 39.41%
- Recently traded at 62.89 which is below its 50 day moving average of 67.67
Alexion Pharmaceuticals (ALXN)
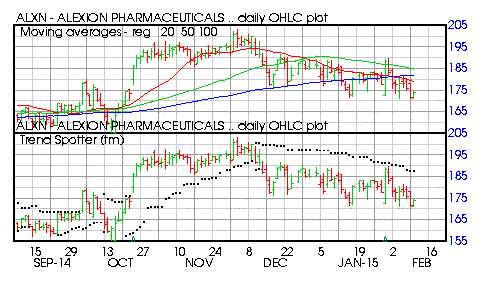
Barchart technical indicators:
- 80% Barchart technical sell signals
- Trend Spotter sell signals
- Below its 20, 50 and 100 day moving averages
- 14.41% off its recent high
- Relative Strength Index 42.46%
- Recently traded at 174.24 which is below its 50 day moving average of 42..46
Fastenal (FAST)
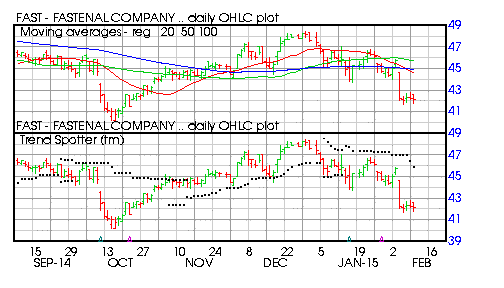
Barchart technical indicators:
- 80% Barchart technical sell signals
- Trend Spotter sell signal
- Below its 20, 50 and 100 day moving averages
- 19.19% off its recent high
- Relative Strength Index 34.29%
- Recently traded at 42.16 which is below its 50 day moving average of 45.71
Microsoft (MSFT)
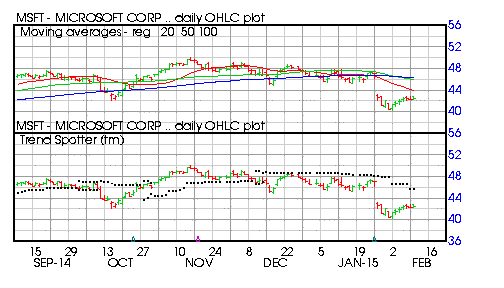
Barchart technical indicators:
- 80% Barchart technical sell signals
- Trend Spotter sell signal
- Below its 20, 50 and 100 day moving averages
- 15.25% off its recent high
- Relative Strength Index 39.77%
- Recently traded at 42.44 which is below its 50 day moving average
Comments
Log in or sign up to join the conversation.