

Strategy Inc. (Nasdaq: MSTR) is approaching an important technical juncture, with both the weekly and daily Elliott Wave structures suggesting the potential completion of a major corrective cycle and the beginning of a new bullish phase.
Our analysis of the weekly and daily charts provides a roadmap for what could come next, including the potential completion of wave ((II)), an ongoing corrective recovery, and a possible significant move higher.
Weekly Chart: A Major Corrective Cycle Complete
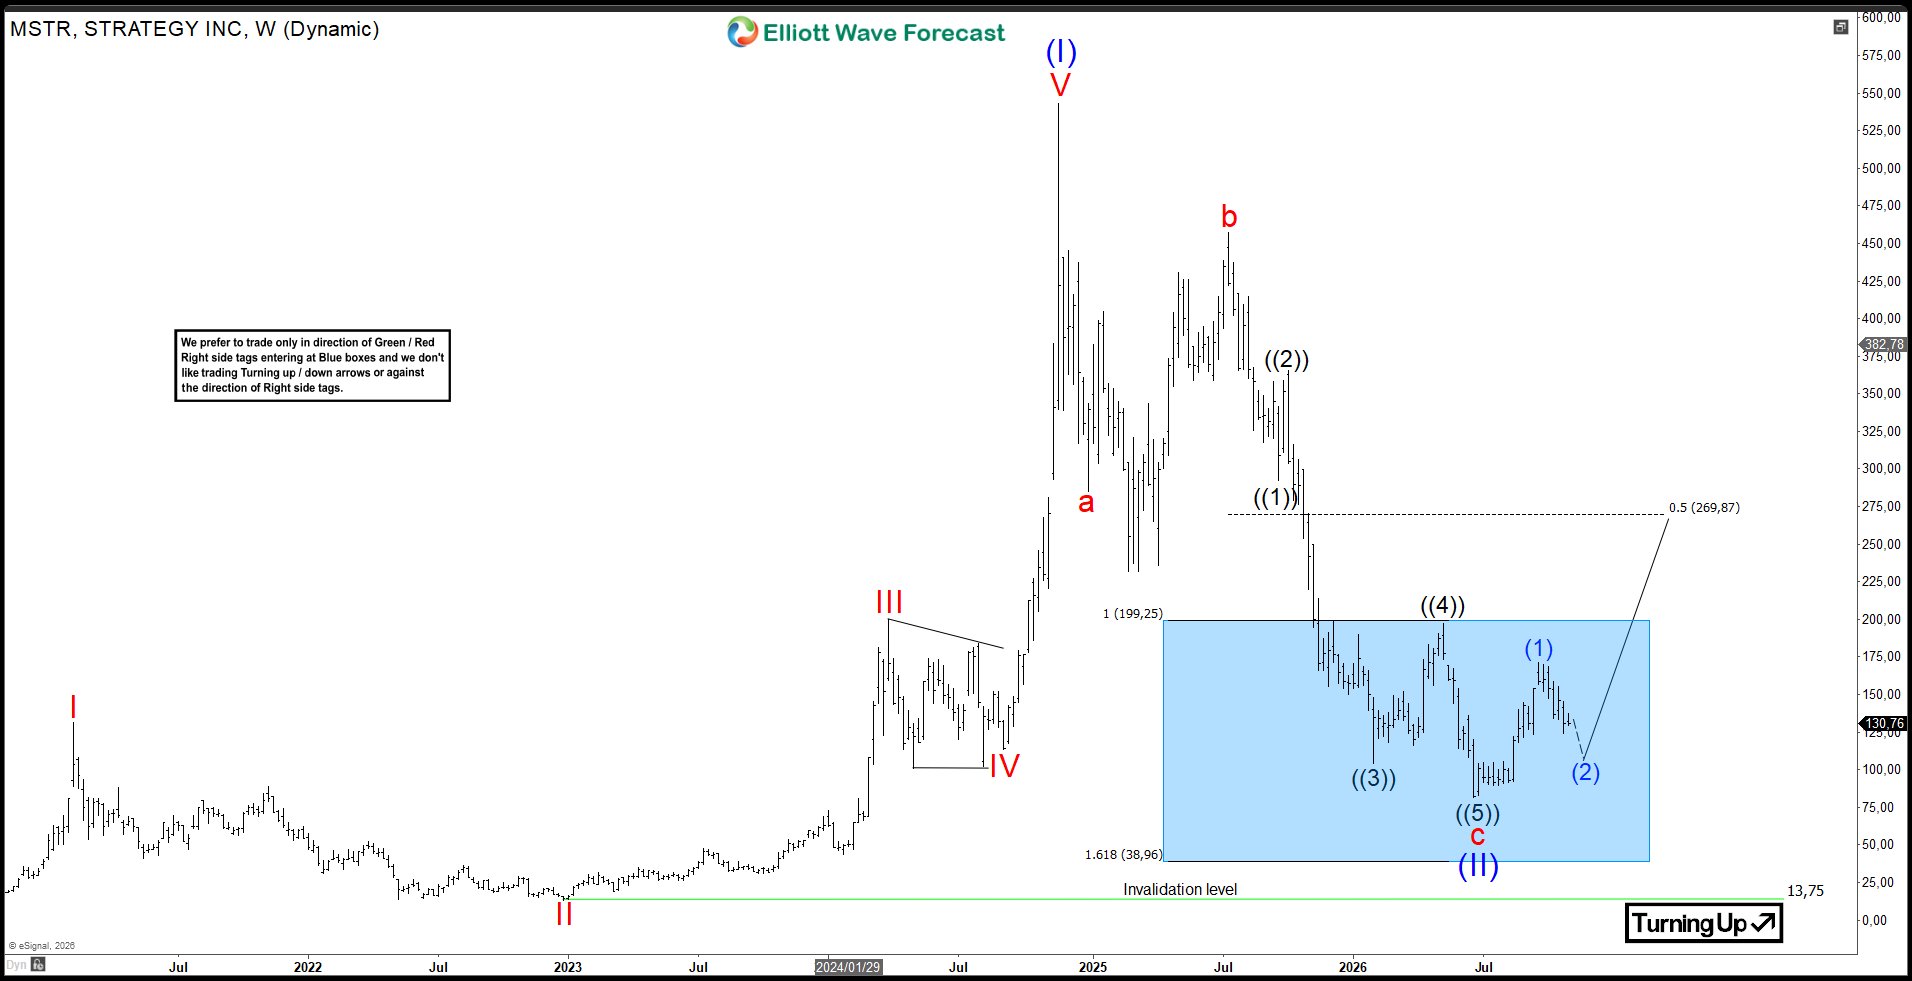
Looking at the weekly chart, MSTR completed a substantial bullish advance from its earlier lows, culminating in wave ((I)) near the $570 region.
Following that peak, the stock entered a prolonged corrective phase, unfolding as a 3 waves Elliott Wave structure. This correction has taken price significantly lower, with the market developing a large corrective formation within the highlighted blue zone.
Our preferred Elliott Wave count suggests that MSTR has completed wave ((II)), with the price to have turned higher in wave (1).
The weekly chart identified an important downside target area between $199.25 - $38.96, based on the projected Fibonacci extension levels. The lower boundary represents the 1.618 extension, while the upper boundary marks the 1.0 extension.
Importantly, the long-term bullish structure remains valid above the major invalidation level at $13.75.
From the current structure, we are looking for the corrective decline to mature, potentially allowing MSTR to establish a significant low before beginning its next major advance.
Wave ((II)) is confirmed complete, the next anticipated development is wave ((III)), which could open the door to a substantial bullish cycle.
Daily Chart: Mapping the Final Stages of the Correction
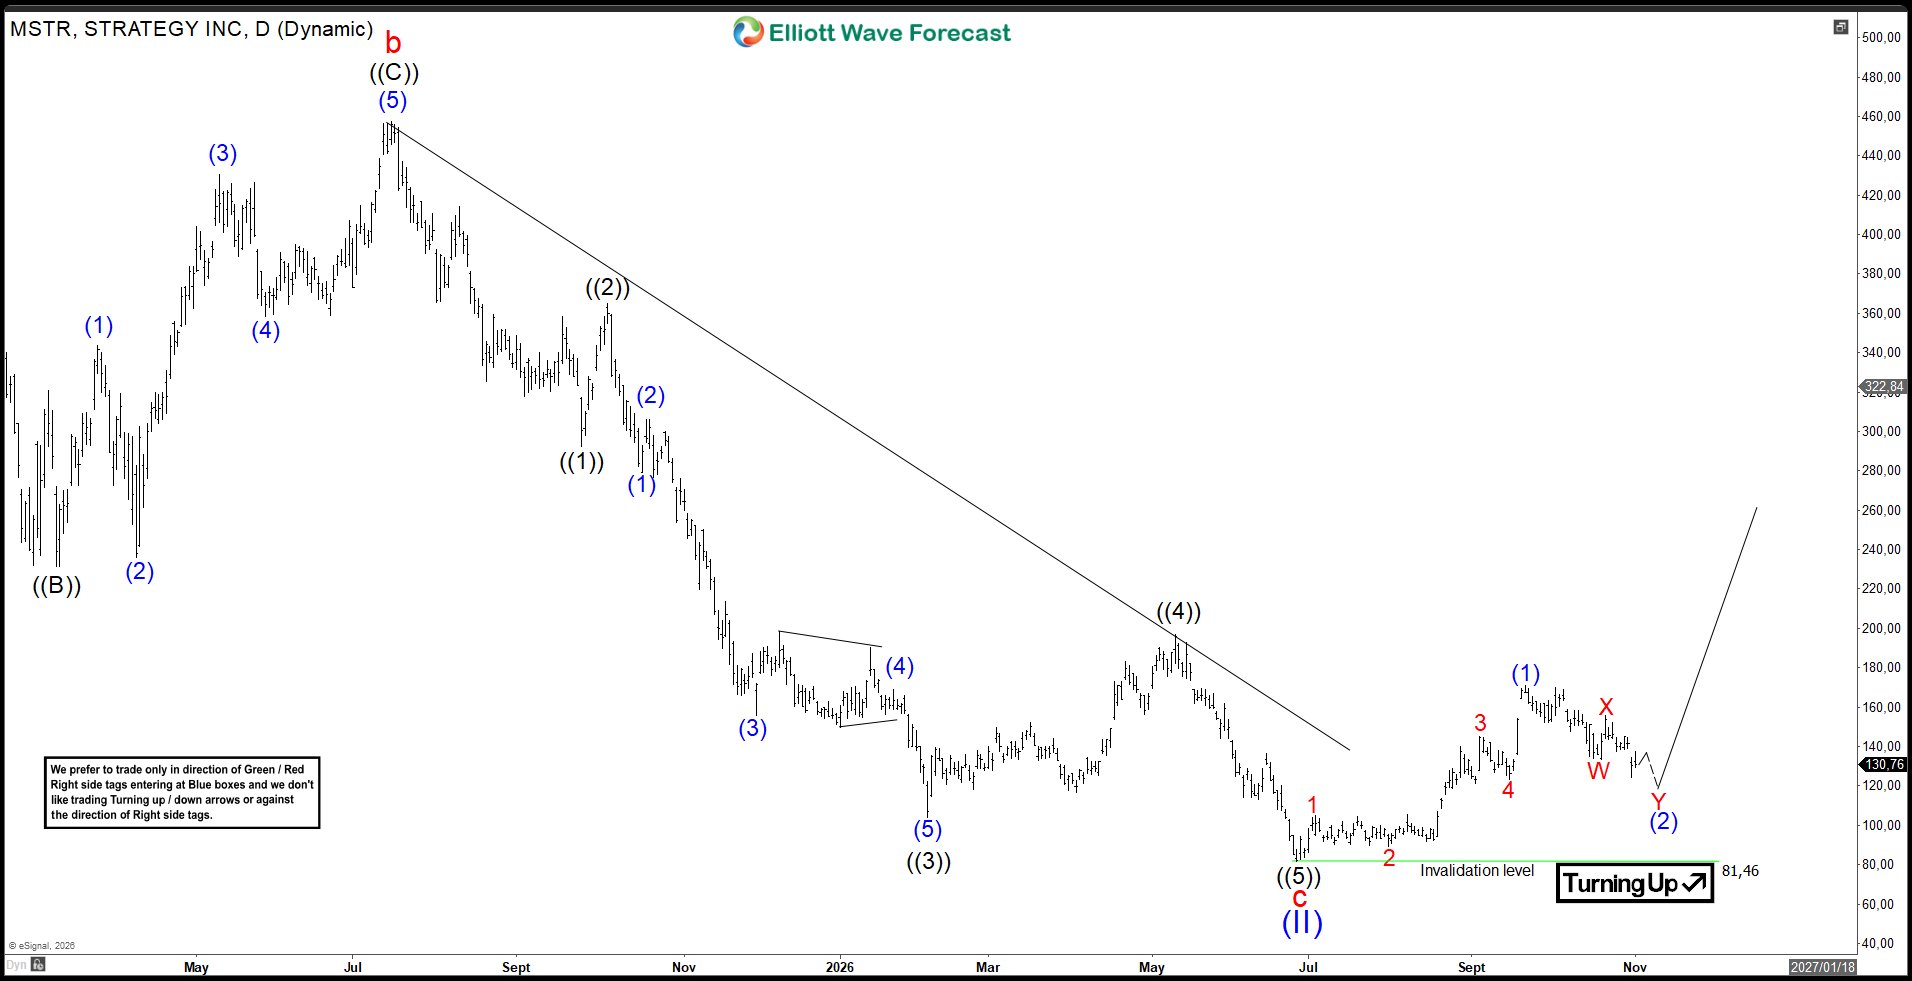
The daily chart provides a closer look at the price action following the major decline from the 2025 peak.
MSTR completed a significant bearish sequence into the June 2026 lows, with the decline marking the potential completion of wave ((II)).
Since that low, price has begun developing a bullish sequence, suggesting that the market may be transitioning into a new upward cycle.
The initial advance has established a potential wave (1), followed by a developing corrective wave (2).
Our preferred count suggests that wave (2) is unfolding as a W-X-Y corrective structure.
The market has already developed the initial W and X components, with the final Y leg potentially still required to complete the correction.
We are therefore monitoring the current price action for a possible final move lower into the projected wave (2) completion area.
The key level to watch on the daily chart is $81.46, which represents the major invalidation level for our bullish scenario.
As long as this level holds, the preferred outlook remains that MSTR is developing a larger bullish reversal structure.
What Comes Next? The Potential for a New Bullish Cycle
Once the daily wave (2) correction is complete, our expectation is for MSTR to turn higher and begin the next impulsive advance.
The initial upside projection on the weekly chart points toward the $269.87 region, corresponding to the 0.5 Fibonacci retracement level.
This would represent an important recovery objective within the broader structure.
The key is allowing the corrective structure to finish before looking for confirmation of the next impulsive advance.
Key Levels to Watch
Weekly Chart:
Major invalidation level: $13.75.
Corrective structure: Wave ((II)).
Fibonacci extension zone: $199.25 - $38.96.
Initial recovery projection: $269.87.
Daily Chart:
Major bullish scenario invalidation: $81.46.
Current structure: Developing wave (2) correction.
Preferred corrective formation: W-X-Y.
Next anticipated move: Completion of wave (2), followed by a bullish advance.
Final Outlook
Our preferred Elliott Wave outlook remains cautiously bullish on MSTR from a higher-timeframe perspective.
The weekly chart suggests that the stock is progressing through a major corrective cycle, while the daily chart indicates that the initial stages of a potential bullish reversal may already be developing.
We are looking for the daily wave (2) correction to complete before anticipating another impulsive move higher.
As always, we prefer to trade in the direction of the confirmed Elliott Wave structure, waiting for the appropriate setups within the projected extreme areas rather than chasing price.
The bigger picture remains focused on the confirmation that wave ((II)) indeed is complete and the beginning of a new bullish cycle in MSTR.



Comments
Log in or sign up to join the conversation.