
Market Overview
For the past few weeks, SPX has been confined to a narrow range which has formed a nearly horizontal channel. On 8/15, it made a high at 2193 and started a lazy corrective action which apparently ended last Thursday at 2157. This does not mean that another uptrend is about to start. Most likely, it means that this was only the beginning of a larger correction which is not quite ready to extend in a significant manner until more distribution has taken place. If this is the case, we could see a few more days of trading within the blue channel before the index turns down for a more decisive correction.
The sideways pattern of the past month and a half has created deceleration at the weekly level which is beginning to turn the momentum indicators down. Last week the SRSI made a bearish cross and the MACD has started to roll over. Their current position, however, shows a lot of intermediate strength which is not going to evaporate overnight, and the coming downtrend (which could last a few weeks) will simply correct their overbought condition and this should be followed by a new market high as a result of which negative divergence will be created in the weekly indicators, signifying that a final high for the bull market is being established.
In a recent letter, I mentioned that few of the leading indexes that we follow - such as IWM and QQQ – show the type of P&F chart pattern which preceded the July and January declines, and the function of the coming correction will be to create such a pattern in preparation for the final top.
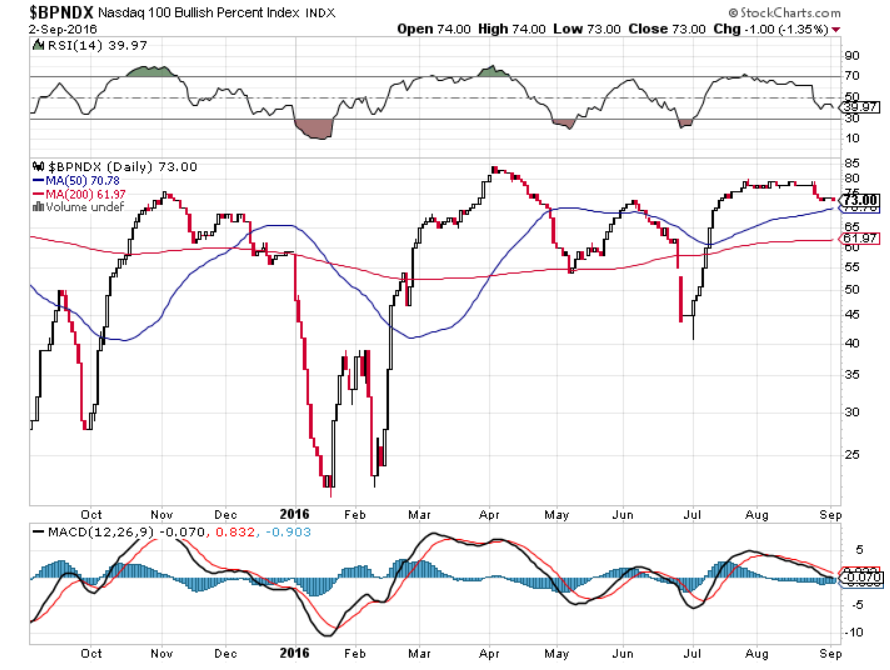
The BPNDX (courtesy of StockCharts.com) has declined to 73 over the past two weeks. If it fails to rally along with NDX over the next week, it will be an additional indication that we are preparing for a market correction.
SPX Chart Analysis (This chart and others below, are courtesy of QCharts.com.)
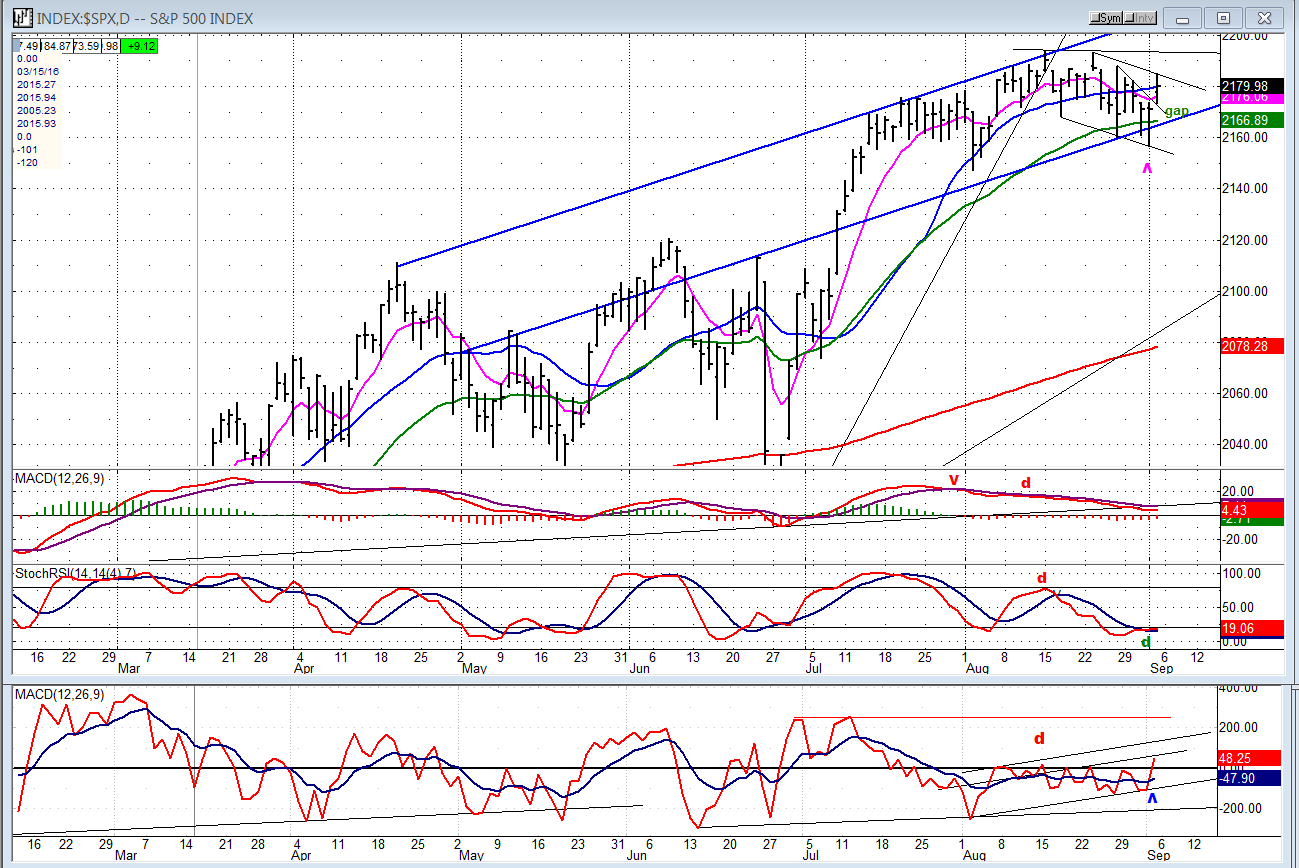
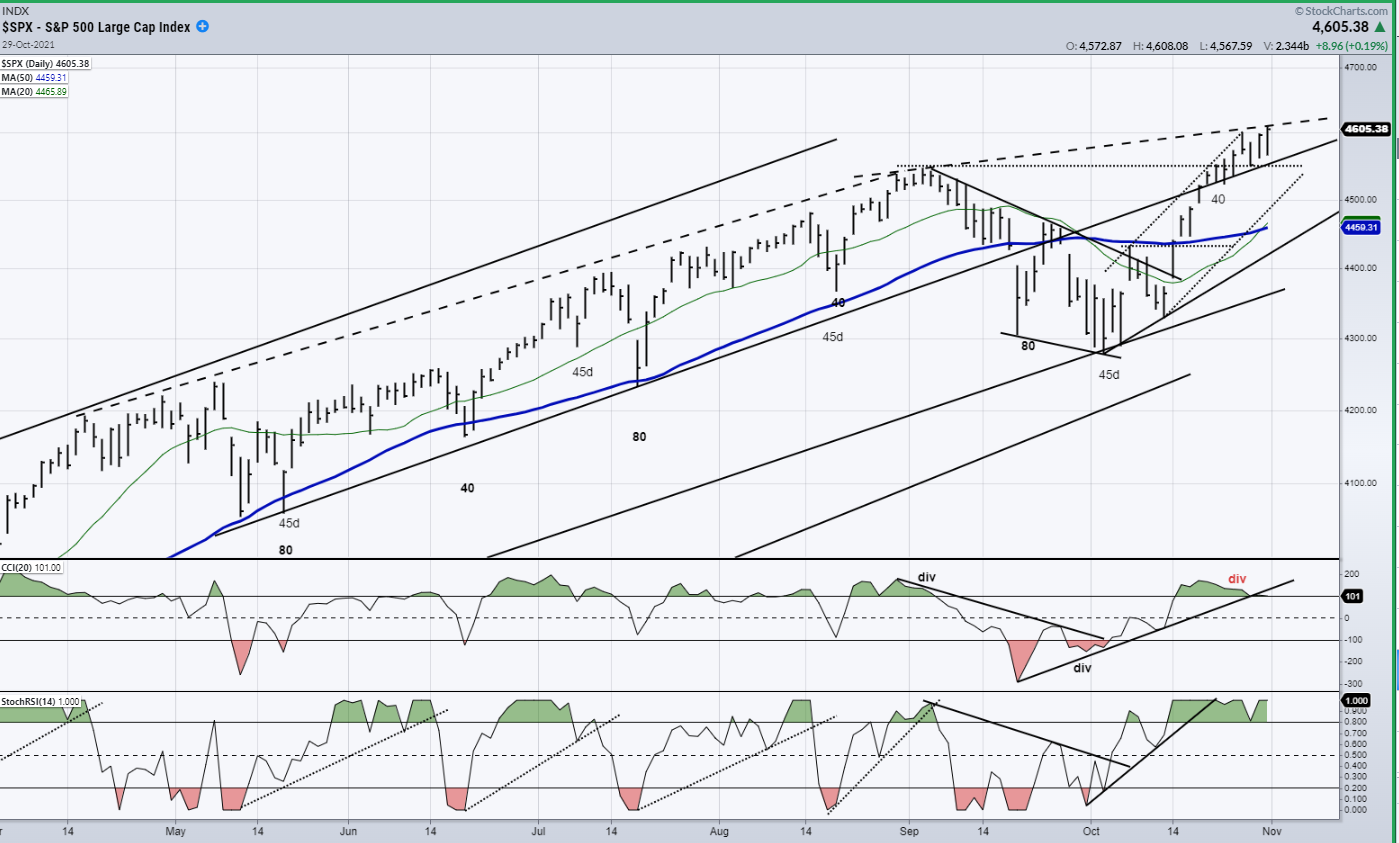
Daily chart
The daily chart clearly illustrates the SPX position. There is a blue resistance line on top and a blue support line at the bottom. The top has been very consistent at stopping advances, with a final attempt being made by the index when it reached 2193. The lower one (which had to be adjusted several times) is being challenged more and more by the bears, with last Thursday breaking through briefly but closing inside the channel and following up with a strong bounce on Friday. The minor corrective pattern from the high is delineated by parallel lines and if we push through on Tuesday, we will put an end to that small correction. If so, we can easily go on to challenge 2193 once again, and perhaps even the top of the blue channel. The moderate jobs report on Friday, created some buying with an opening gap. This normally indicates that there will be some follow-through, but this would be more likely if SPX had closed on its high of the day.
The daily indicators do seem to point to some additional strength over the next few days. They are oversold and in a good position to move higher. The MACD has corrected to near the zero line, but looks ready to turn up. The SRSI showed some positive divergence on Thursday by making a higher low, and the A/D indicator looks as if it is breaking out. I would not expect a big move on the upside at this juncture, but a retest of the high is a good possibility.
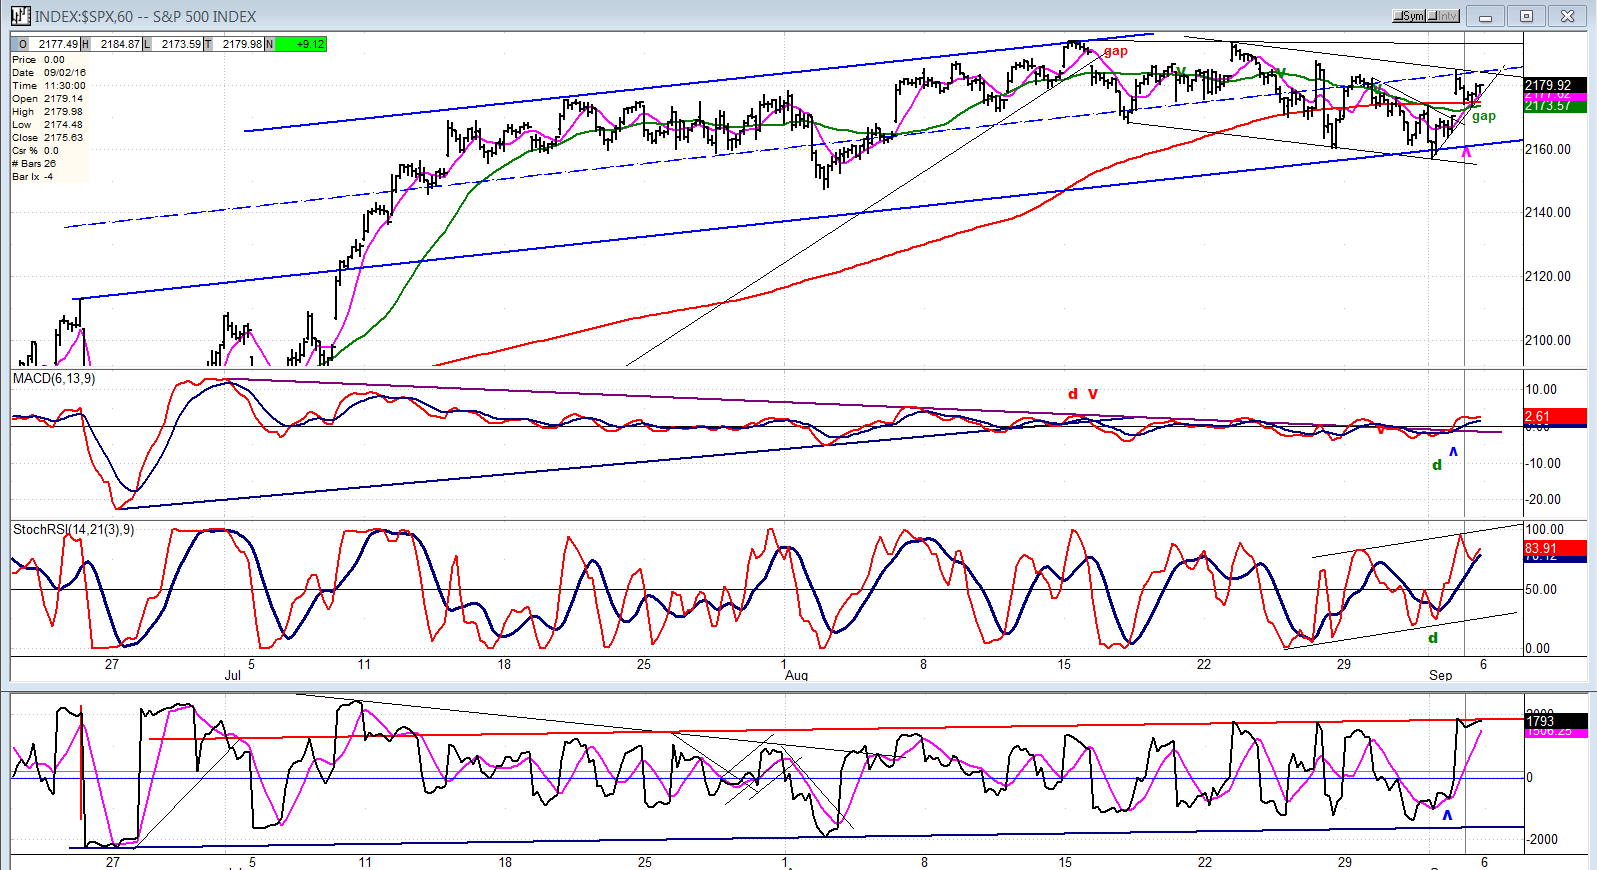
Hourly Chart
The hourly chart is also easy to interpret, especially the gyrations of the index within the channel that it has created. Note that the 2193 gap was followed by a downside gap which started the entire correction. On Friday, we had an upside gap which the index tried to fill after the first hour, but which it could not, ending the day on a bounce which remained short of the high.
Using the channel for analysis, it can be divided into two nearly equal portions with the dashed line representing the middle of the channel acting as support until the last week or so when it was finally broken decisively. The index went on to find additional support at the bottom of the channel where it held twice before starting Thursday’s rally. The middle of the channel is now acting as resistance, so far stopping the two bounces from the low. Friday’s was stronger and stands a good chance of following through, (perhaps after a little more consolidation?) either to challenge the former high of 2193, or even going a little higher. If this is all it does, we could expect that the next time we turn down, the bottom of the channel will be broken conclusively and the long-awaited short-term correction will start.
The indicators have become overbought with the A/Ds creating a channel of their own and, once again, rising to its top. If we go through on Tuesday, then we have started the next short-term uptrend. If we don’t, and find the need for additional consolidation, it will add to the idea that this will be merely a test of the high.
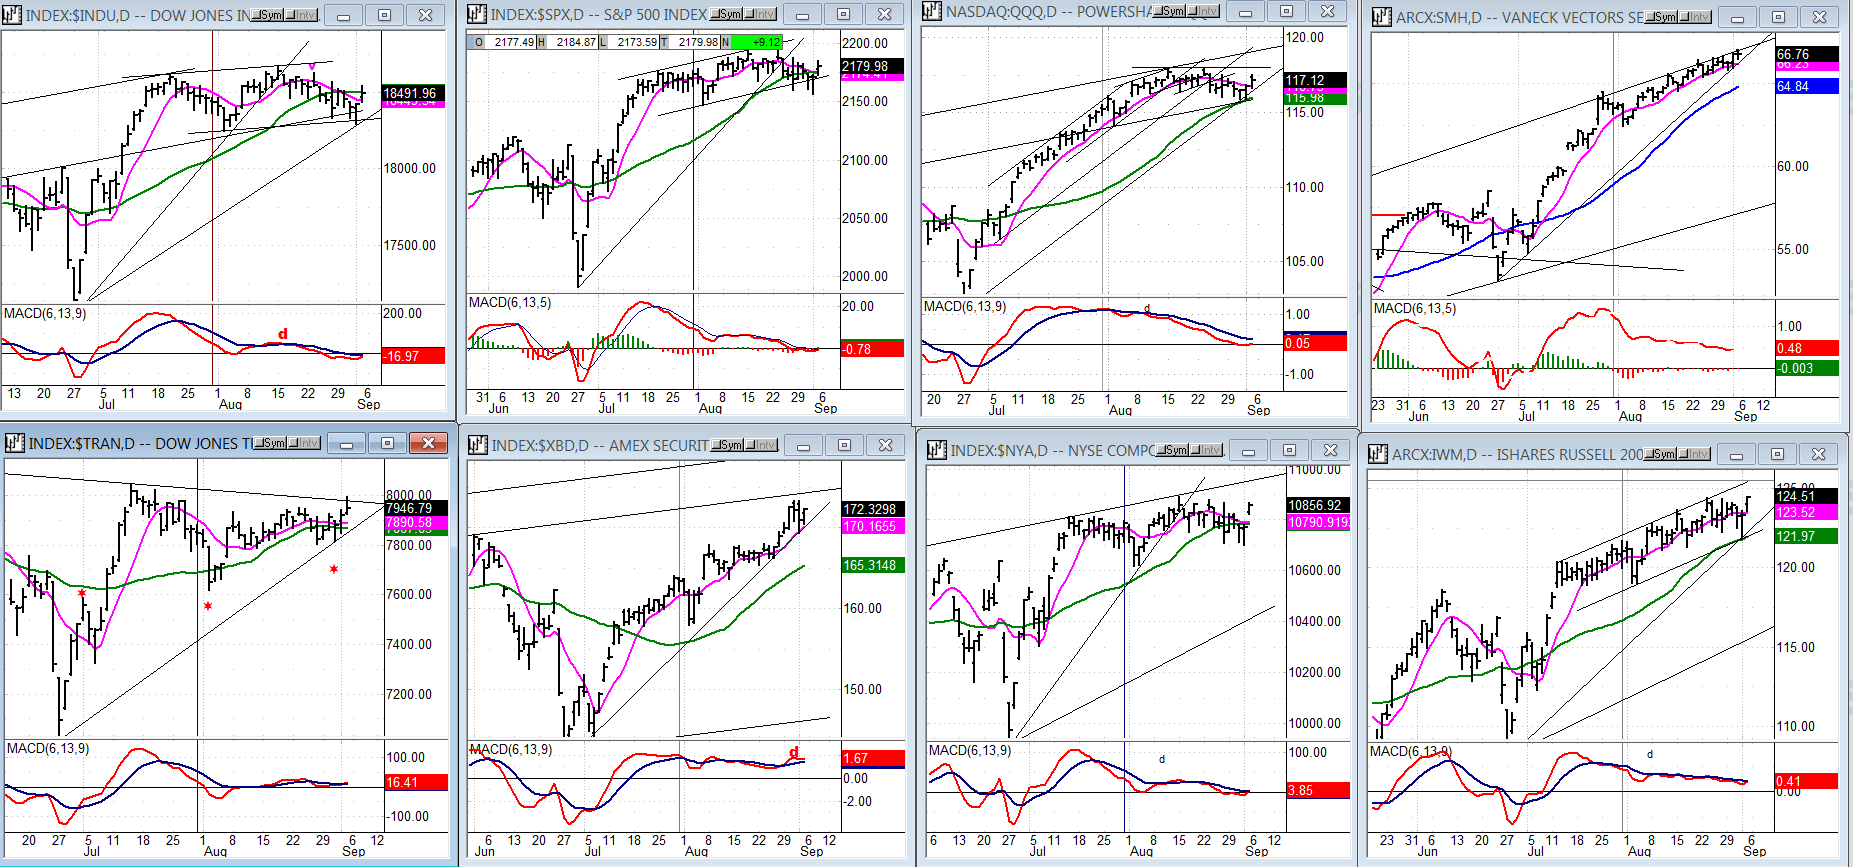
Some leading & confirming indexes (Daily charts)
Congestion (distribution) is appearing on some indices at the daily level while others are free of it -- even XBD which has been one of the weakest indices, has created a new uptrend. SMH and IWM have continued to move higher telling us that whatever correction is coming, as suggested by the negative divergence in their MACDs, it will not be that severe.
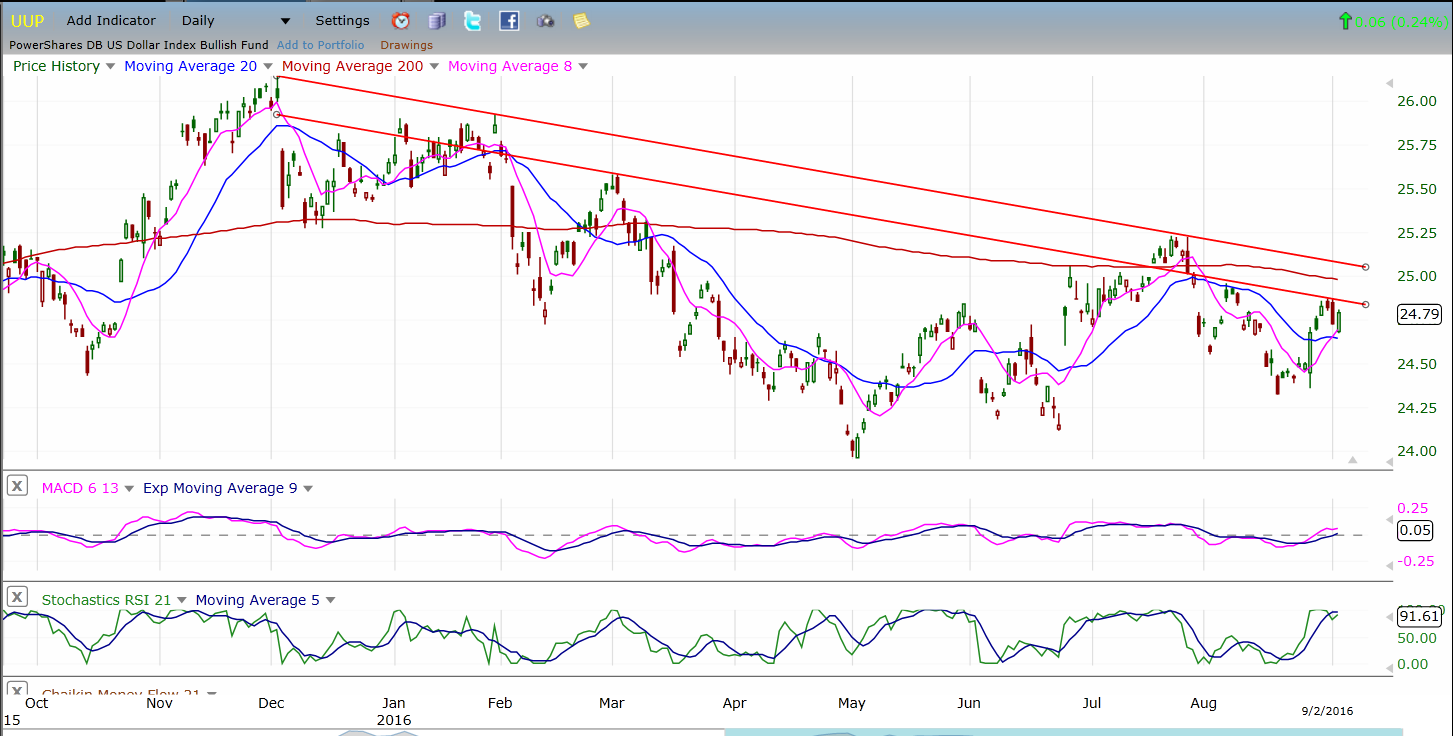
UUP (dollar ETF)
UUP has tried to resume its long-term uptrend but was pushed back when it reached its intermediate downtrend line. After a correction, it is trying once again, finding resistance at a secondary level which may be only temporary. Even if it goes up from here, it will still be challenged by the main trend line and the 200-dma. It may have a better chance of breaking through this time and rising to the next level of resistance at 26.00
GDX (Gold Miners ETF)
After reaching its base projection of about 31, GDX started a correction which is likely not over. The first phase of the decline has broken a secondary uptrend line and the primary one as well. This has brought it to a temporary support level from which it has rebounded. If it follows a traditional pattern, it will have an a-b-c correction and may have already completed its “a” wave, although it has not yet quite retraced .382 of its decline from the top.
The indicators, especially the weekly ones, are not in a position to support an uptrend which would take it to a new high. Also, the top P&F pattern suggests that the index should be making new lows before completing its correction.
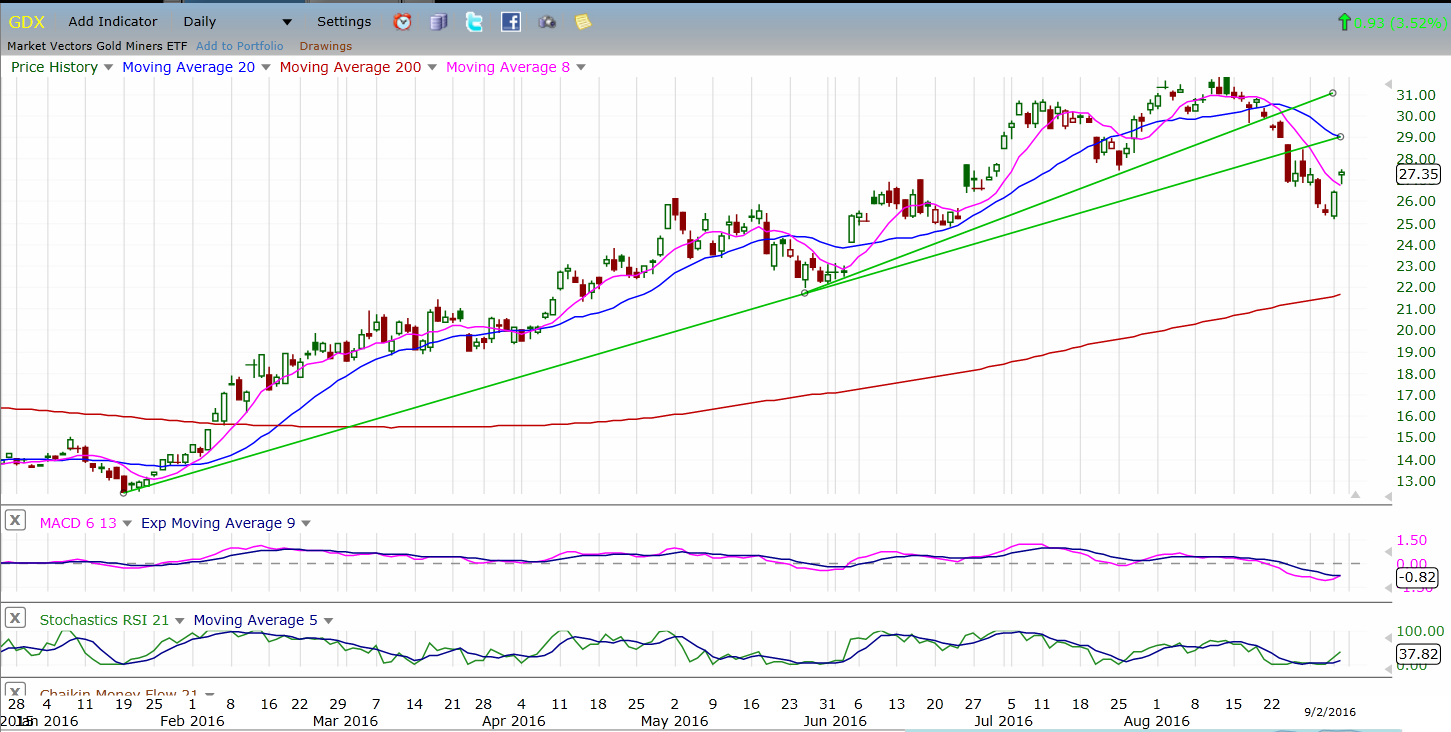
Note: GDX is now updated for subscribers throughout the day along with SPX, on Marketurningpoints.com.
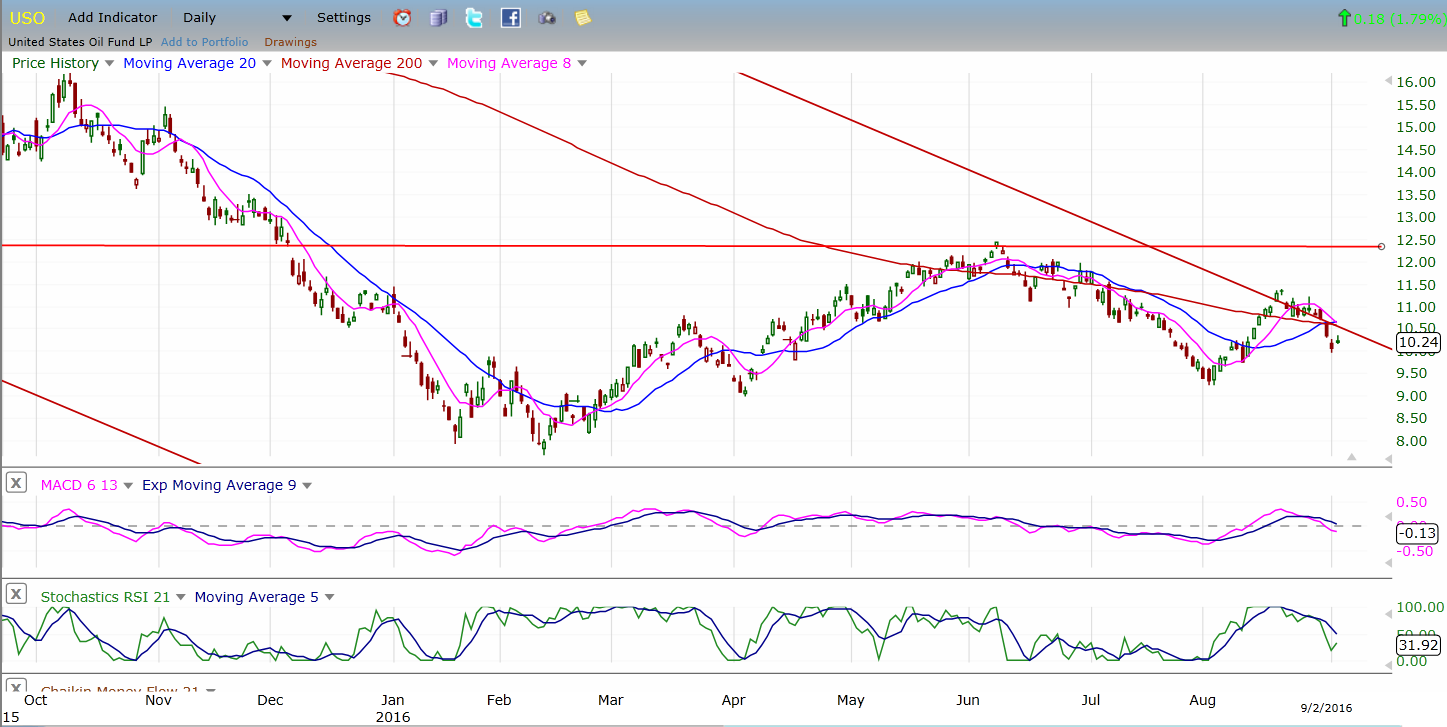
USO (US Oil Trust)
USO’s second effort at establishing a new uptrend has failed after being repulsed by its long-term downtrend line from its 118 high. With a slightly lower count, it may have to do more work before it can maneuver its way through it and challenge, once again, the strong resistance level which halted the first advance.
Summary
SPX may have made a temporary high when it reached 2193, but it could retest it before starting a genuine correction, something for which it has been preparing during the past six weeks.
Friday’s action suggests that a little more distribution is likely before the top-building period is complete.


Comments
Log in or sign up to join the conversation.