

Articles regarding the signals emanating yield curve appear in Reuters, CNBC, FoxBusiness, Bloomberg, CNN . Here’s a relevant picture:
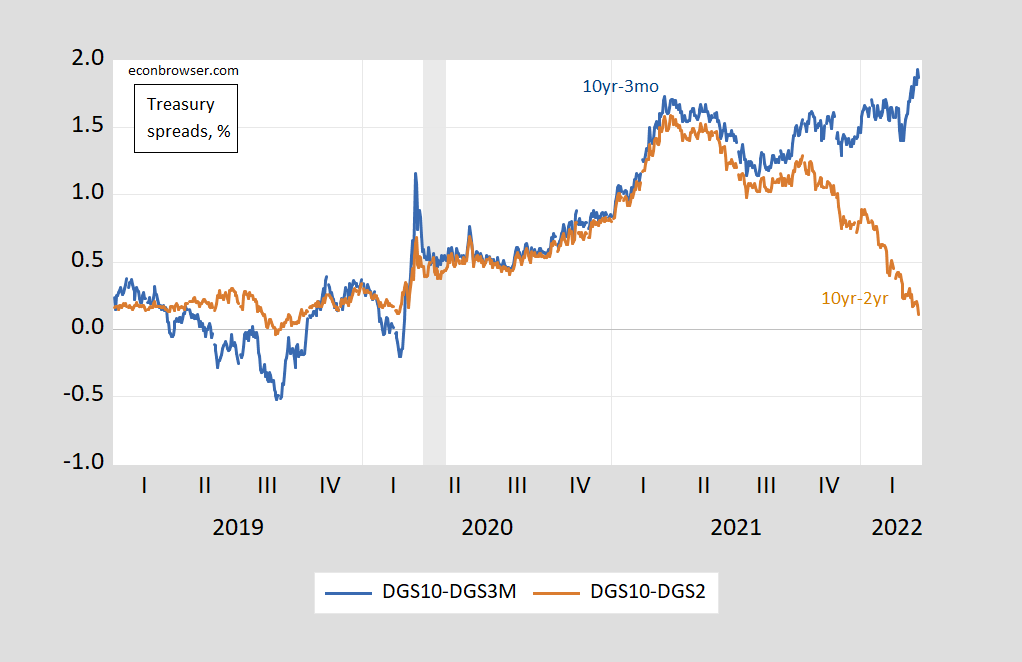
Figure 1: 10 year – 3 month Treasury spread (blue), 10 year – 2 year spread (teal), all in %. NBER defined recession dates shaded gray. Source: FRED, NBER, and author’s calculations.
The 10yr-2yr spread is approaching zero, so that segment of the yield curve would be closing in on inversion, a sometime precursor to recession.
Inspection of the yield curve today, and at several points in time, suggests that yesterday’s inversion does not apply to a wide segment of curve.
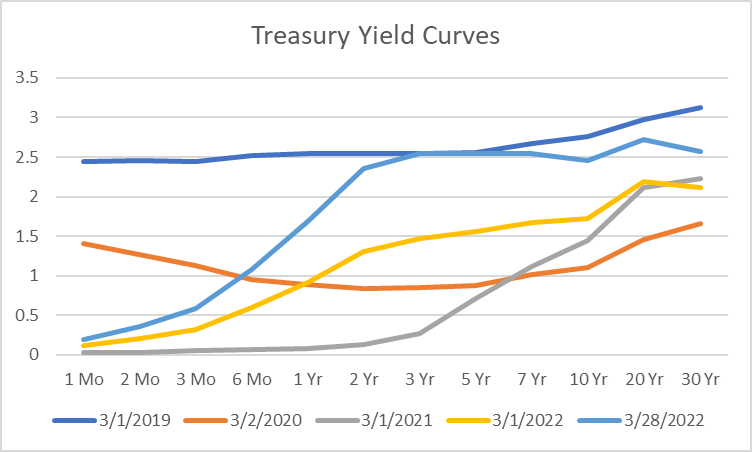
Figure 2: Yields for Treasurys at different maturities, in %. Source: Treasury.
Note that as of yesterday, inversion is only showing up at the 10yr-7yr segment.
The rationale for inversion serving as a precursor to recession is the idea that lower expected future short rates during recessions drive lower longer maturity rates. In principle, a “cleaner” look at how expected future short rates look relative to the current short rate can be obtained by removing the term premium (presumably driven by inflation risk) for the long maturity. In Figure 3, I show the spreads adjusted by DKW estimated inflation risk premia.
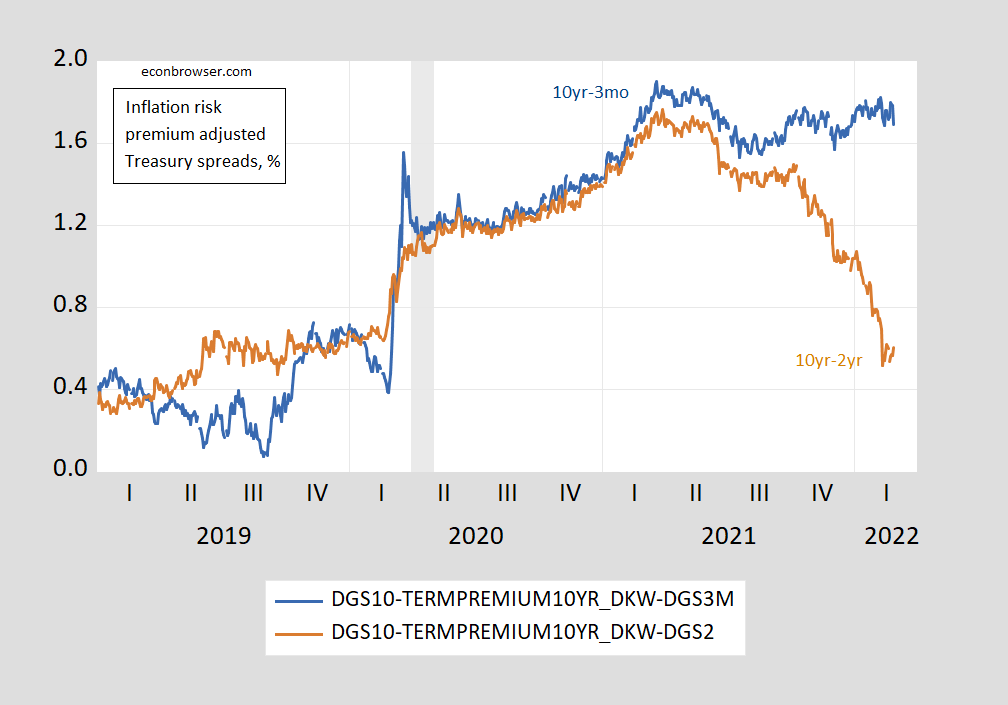
Figure 3: 10 year – 3 month Treasury spread subtracting estimated inflation risk premium (blue), 10 year – 2 year spread subtracting estimated inflation risk premium (teal), all in %. NBER defined recession dates shaded gray. Source: Treasury via FRED, NBER, KWW following DKW, and author’s calculations.
When the 10 yr-3 mo spread is purged of the term premium on the 10 year Treasury, then in principle that variable measures the expected short term interest rates over the next 10 years relative to the current 3-month yield. This is what the unadjusted and adjusted 10yr-3mo spread looks like over the past 3 decades.
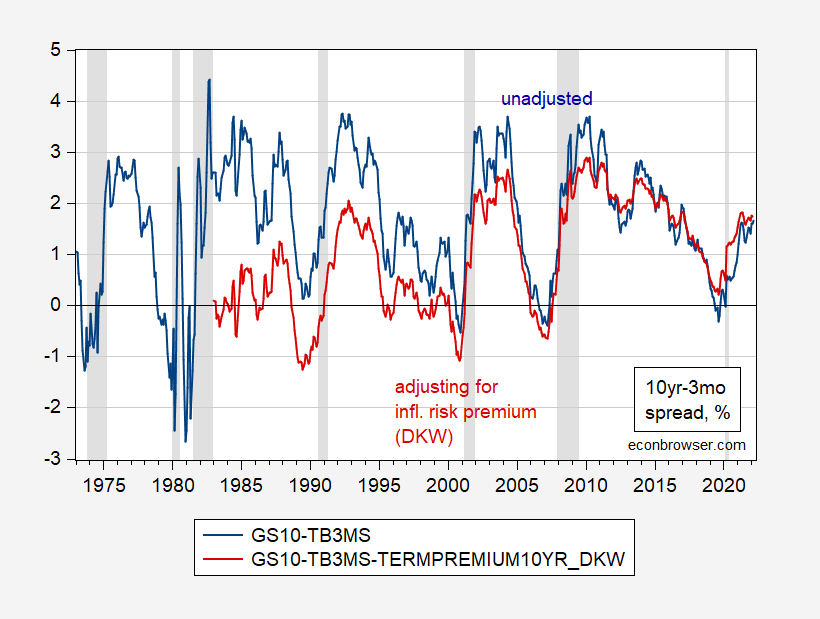
Figure 4: 10yr-3mo Treasury spread (blue), 10yr-3mo spread minus 10-year inflation risk premium (red). NBER defined recession dates as peak-to-trough shaded gray. Source: Source: Treasury via FRED, NBER, KWW following DKW, and author’s calculations.
Note deep inversions of the adjusted series typically precede recessions



Comments
Log in or sign up to join the conversation.