

In an EconoFact post from Saturday, Michael Klein and I noted that usually the trade deficit grows during times of robust economic growth.
Here I provide an additional way of looking at the relationship between growth and trade deficits — namely scatter plots for the periods from recession trough to peak.
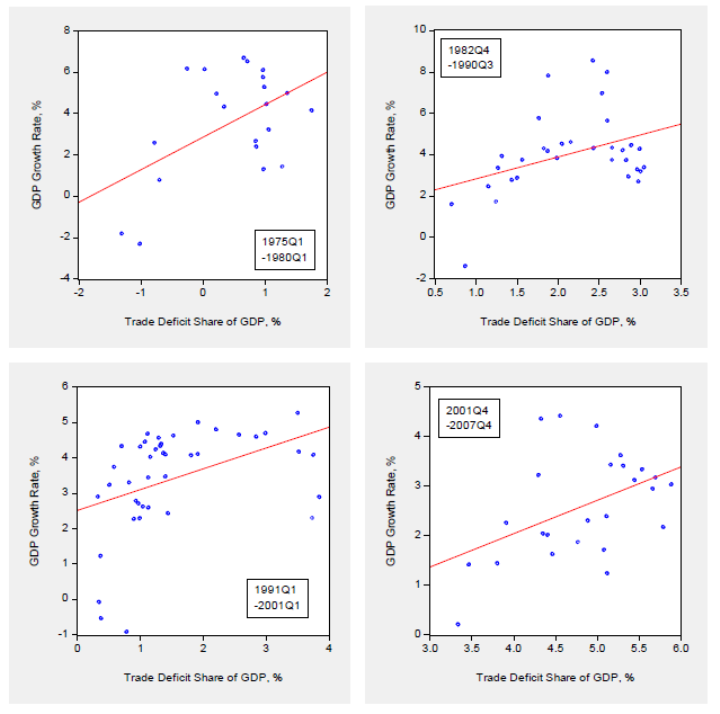
Figure 1: Annualized q/q real GDP growth, % against nominal trade deficit as share of nominal GDP, % for recession trough-to-peak samples. Source: GDP 2016Q3 3rd release, NBER, and author’s calculations.
Notice the clear correlation — as growth accelerates, trade deficits widen.
To understand how thinking in accounting terms can lead to misleading inferences, consider the statement in a Washington Post opinion piece, Peter Navarro and Wilbur Ross wrote:
Net exports are currently running at a negative $500 billion annually, a direct subtraction from growth.
While this is true in terms of accounting, it’s a misleading statement. Consider a firm with revenues of $3 million, and labor and materials costs of $1 million, and hence profits are $2 million. The $1 million in costs are a direct subtraction from $3 million in revenues, but if no labor and materials were purchased and costs $0 million, profits would not be $3 million, but zero.



Comments
Log in or sign up to join the conversation.