

Economic Stability
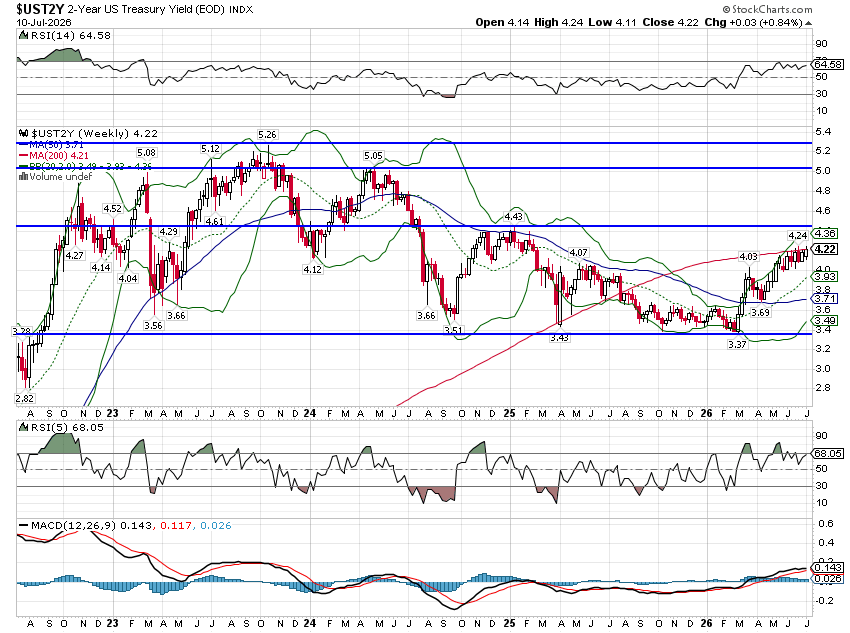
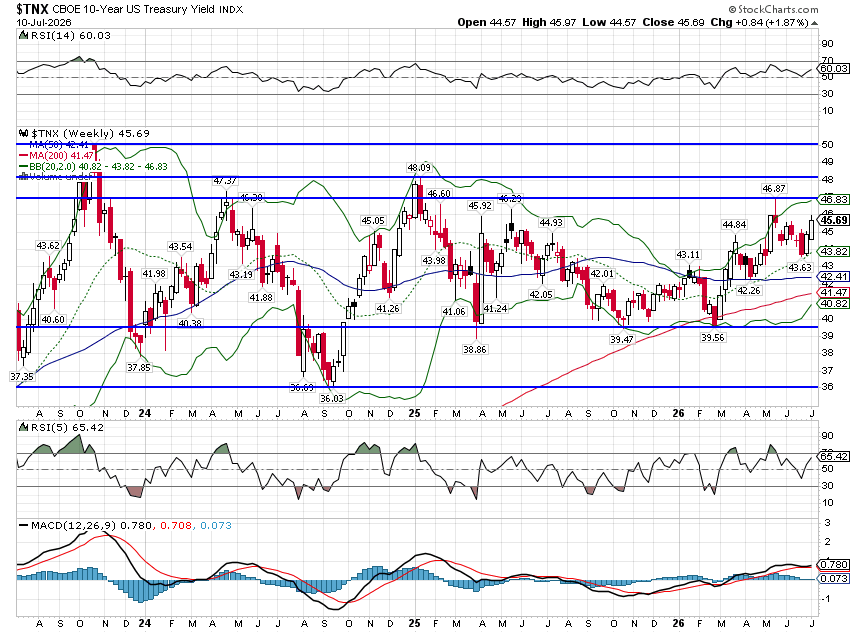
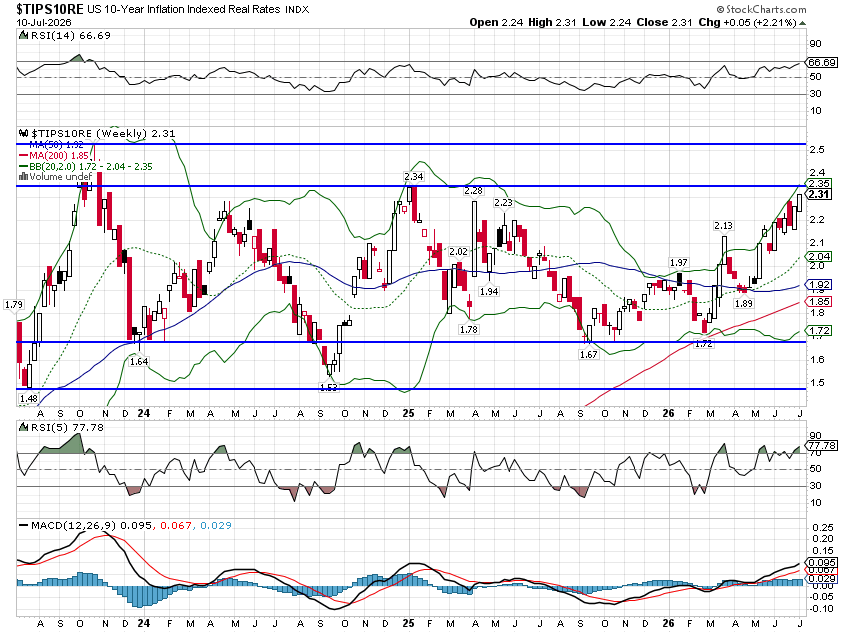
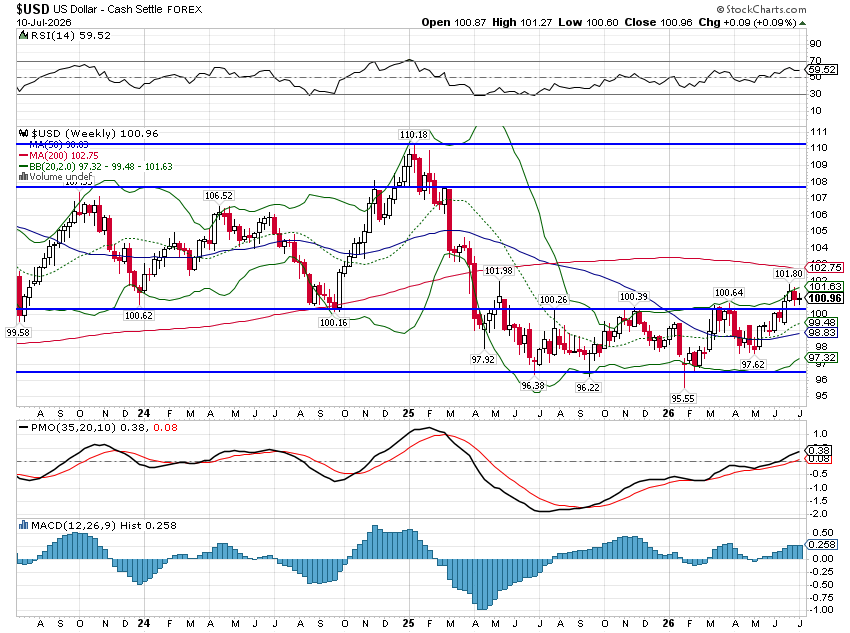
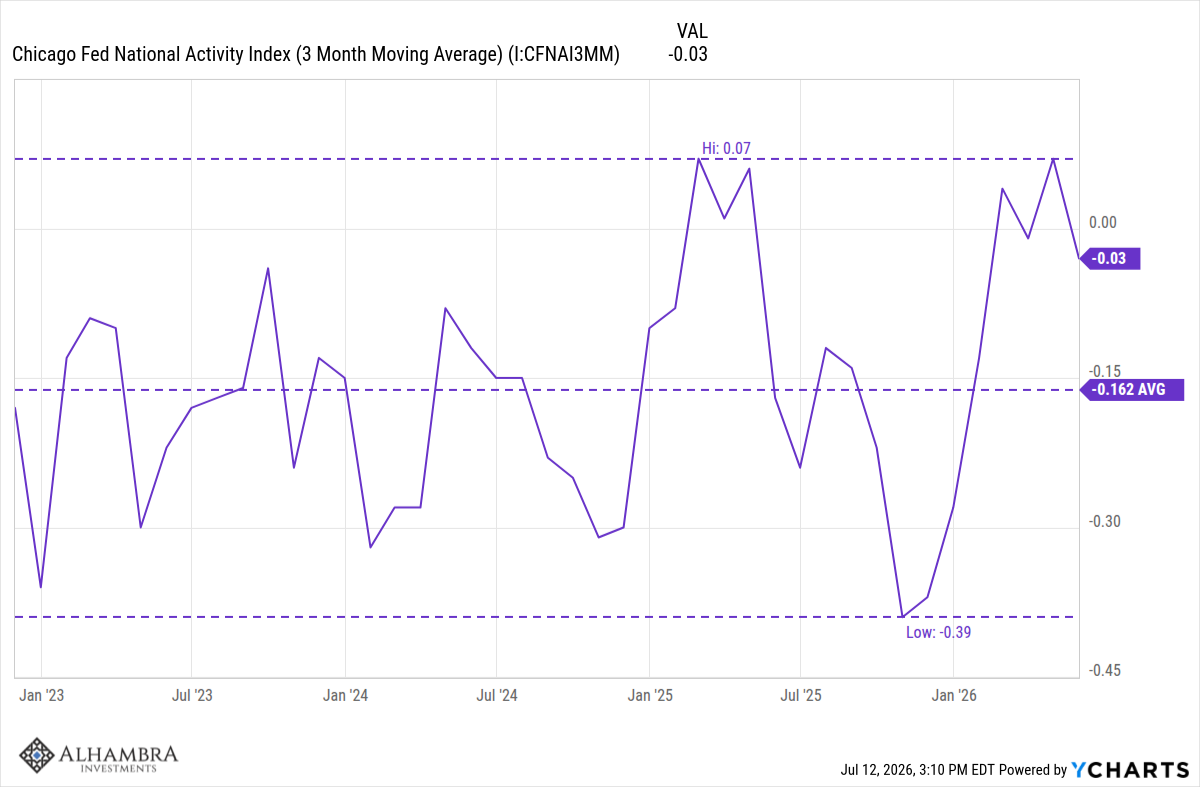
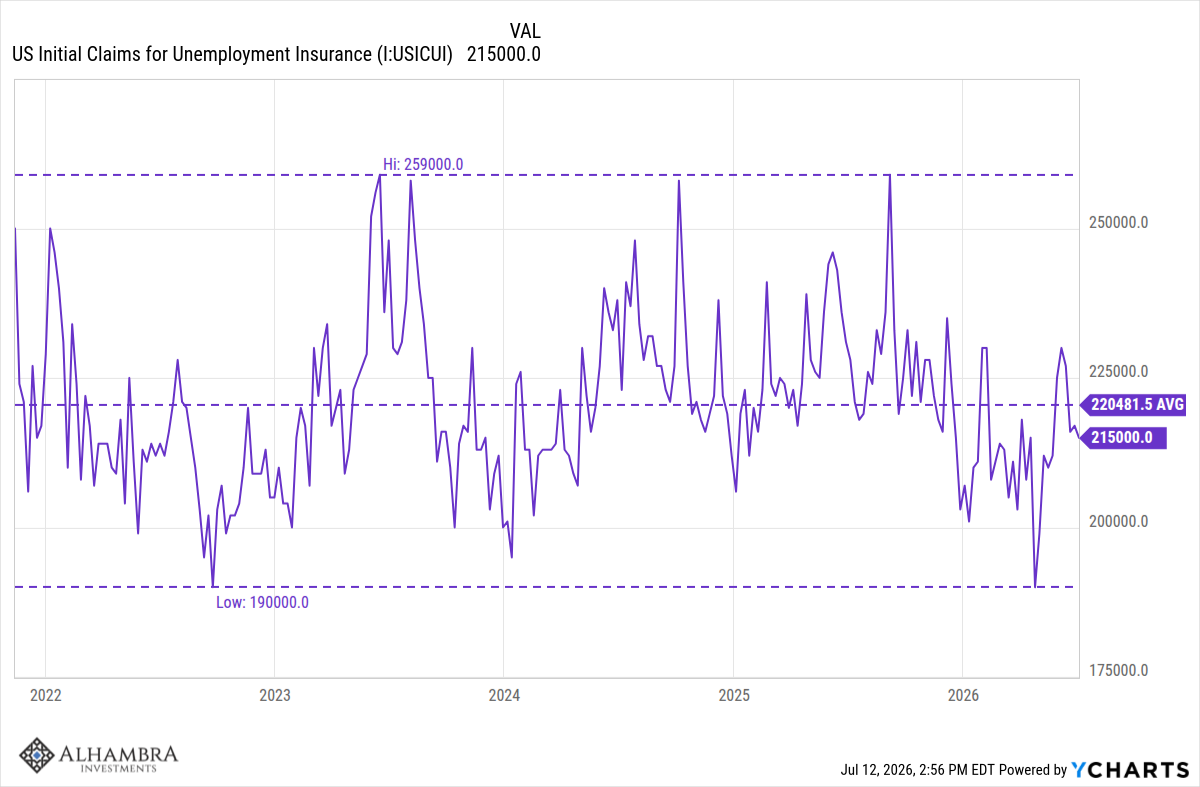
One of the remarkable things about the US economy is how stable it has been over the last 4 years. I know it doesn’t feel that way sometimes – most of the time? – but from an aggregate viewpoint, that is the reality. We can see this stability in a variety of economic reports as well as in the markets. Interest are up this year across the yield curve but they are all still basically in the ranges they’ve established over the last 3 to 4 years. The dollar is up this year but is still in the bottom end of the range it has been in since late 2022. The 3 month average of the Chicago Fed National Activity Index is currently at -0.03, where a reading of 0.0 means trend growth. Initial claims for unemployment insurance have been in a range of 190k to 259k since November of 2021, a very stable – and low – level of claims. The US economy is like a supertanker; it takes a lot to steer it away from its existing course.
2 Year Treasury Rate
10 Year Treasury Rate
10 Year TIPS Rate (Real rates)
US Dollar Index
CFNAI – 3 Month Average
Initial Claims for Unemployment Insurance
This macro, surface stability exists alongside micro instability. The Iran War cease fire seems to have failed and oil prices are starting to rise again. Ukraine has been fighting Russia over this entire four year period. The China/US rivalry is still in full swing as China continues to restrict the global supply of rare earths and the US moves on Venezuela and Iran. Europe is in the midst of a complete defense makeover after being rejected by President Trump. The UK is a post-Brexit mess and Japan’s Yen is crashing to multi-decade lows. There’s a lot going on in the world and a lot of it isn’t good.
The administration’s trade policies add another element of uncertainty with the tariff schedule changing dramatically over the last 18 months. Trade policy has affected the economy but probably not in the way the administration would like. As trade policy shifts, companies use pauses to load up on inventory and sell them down when tariffs are in place. Just like last year, we are seeing that play out now as companies try to build up inventory before the new tariffs are announced, likely in August. Imports have grown every month this year; the goods deficit jumped over 25% from April to May to $106.5 billion. Inbound cargo at major US container ports are at all time highs. Even so, it hasn’t been enough as inventories/sales ratios continue to fall as the US consumer is also aware of impending tariffs.
Inflation continues to be a problem with consumer prices up 4.2% year over year in May. Most of that is being blamed on the oil price spike from the Iran War but there’s more to it than that. The year over year change in producer prices at the end of last year was 3.1%; today it is 6.4%. Import and export prices are also rising rapidly with the former up 6.7% and the latter 11.2% over the last year. Some of that is energy but it is also from the AI buildout where chip and raw materials prices have spiked due to demand. The US may design the chips but we don’t make most of them so the price hikes show up in import prices (which are measured pre-tariff by the way). Copper, steel and aluminum prices have risen dramatically, some from tariffs but also from increased demand. According to a recent KC Fed survey, about a third of US manufacturers report that they are successfully passing through more than 60% of cost increases to customers.
Personal income and spending have both decelerated over the last year. Real disposable personal income (after taxes and inflation) turned negative on a year over year basis in April. The May report pulled it back up to flat but May’s income report included a one-off payment to farmers to compensate for their tariff losses. Real personal consumption’s rate of change has also fallen but is now at about the long term average. Unfortunately, the lack of income growth means that consumption, at least in the middle and low income cohorts, is being maintained by debt and a drop in savings. Upper income consumption is being driven by stock market gains and lower taxes.
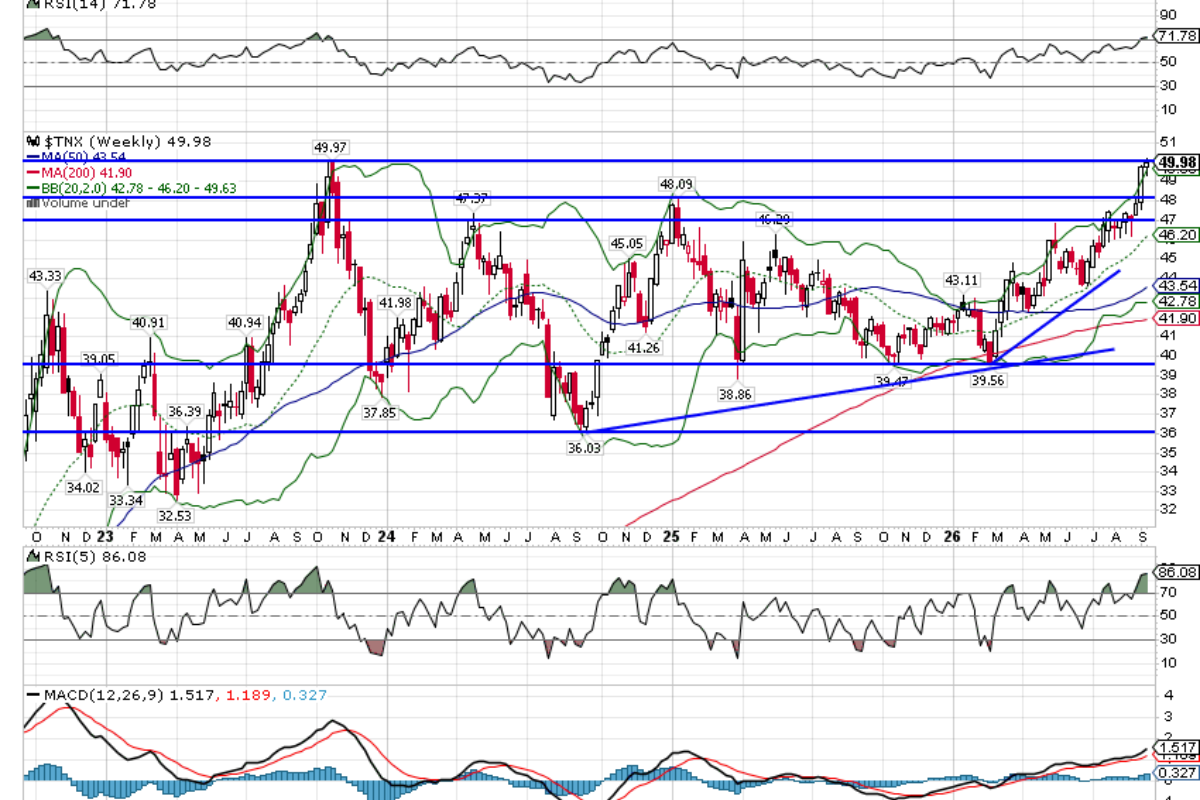
In addition to all this, we have the AI boom and the unknown of how that will impact, well, everything. There really isn’t any reason to believe AI has started to impact the entire economy through increased productivity but building the infrastructure for it is certainly having an impact. Regardless of the ultimate impact of AI, the buildout is affecting what has been the best part of the US economy. The US tech industry has been the driver of the US economy for at least the last 15 years, using a capital light corporate structure. Apple, for example, designs products in the US but manufactures them in China, India and other lower cost areas. Microsoft and other (mostly) software companies have high margins and low capital needs. But the AI buildout requires investments in capital intensive hardware, a shift that will almost certainly reduce future returns. This surge in capital demand has driven up real interest rates with the 5 year TIPS yield nearing 2% and the 10 year well over that threshold at 2.3%.
The AI buildout is impacting supply chains and driving up prices. In looking through the PPI report, durable goods orders, the ISM and the regional Fed surveys, one sees that prices are rising for primary metals (+15.9% yoy), industrial machinery (some from reshoring) and computers and electronics. Much of what we need to build the data centers that drive AI is imported, from copper and aluminum to chips and other high tech hardware. Lead times for semiconductors, fiber and other materials needed for data center construction have reportedly stretched out to as much as 40 weeks. Data centers also use a lot of copper as do the powerplants that power them and the world has a structural shortage already. Ramping up copper supply is a capital intensive and lengthy process so this won’t go away anytime soon. We’ve already seen a lot of deadlines pushed out for new AI capacity to 2027/2028 from this year. I can’t help but think that Wall Street and most of the AI evangelists (AI companies and their VCs) are likely way too optimistic about their timeline for AI.
Another slight negative, there has been a noticeable slowing in the labor market over the last year, although it has little to do with the AI boom. The average monthly change in jobs was 183k from 2010 to the end of 2019 (pre-COVID), 166k in 2023 and 2024 (post COVID) but since the beginning of 2025 just 37k. There could be a lot of reasons for the slowdown, but the main ones are likely economic policy uncertainty, demographics and immigration policy. The latest employment report showed a gain of 57k jobs in June and negative revisions (-74k) to the two prior months. The unemployment rate fell but only because of a drop in the labor force and the participation rate. Pay attention to the revisions.
The US economy has some definite negatives: poor employment growth, inflation well above monetary targets, falling real incomes, consumption propped up by falling savings and a stock market wealth effect and geopolitical instability. But it has some positives too: high levels of investment from AI and the permanent 100% expensing for equipment and R&D in the OBBBA, a lack of stress in credit markets (credit spreads near multi-decade lows), abundant energy even in the face of reduced ME supplies and a stable dollar. It seems that when you add up the positives and negatives you end up back at the trend growth of 2 to 2.5%.
The Return Of Operation Twist
Despite this seeming stability, I do think a word of caution is warranted; we shouldn’t be too sanguine. Some of the market based indicators we have traditionally used may not be as effective as they once were. For example, we have traditionally used term spreads (the ‘yield curves’) to help determine where we are in the business cycle. Two things have happened to render that signal less useful. First is that everyone now knows about the connection between the yield curve and recessions; widespread knowledge of an indicator almost always reduces its effectiveness. Second is that the Treasury is actively targeting the term spread as a policy tool. Before he was named Treasury Secretary, Scott Bessent wrote extensively about how the Yellen Treasury was reducing the issuance of long term bonds in an effort to keep long term interest rates down. He called it “shadow QE” and politically motivated.
Now that he’s leading the Treasury he must think it’s okay because he’s doing the same thing except more so. The vast majority of the deficit is being financed at the short end of the yield curve. Roughly a third of outstanding Treasuries now mature in less than two years. The result is that the Treasury has to roll over about 15% of all outstanding debt on a quarterly basis. Meanwhile, he has indicated no change in the auction amounts for longer term debt. The result is what we see in the change in rates this year where 2 year yields are up 73 basis points while the 10 year rate is up just 41. That means the spread between those two yields has narrowed – the 10 year/2 year yield curve has flattened (bear flattener) which is generally associated with lower future growth, as the rise in short term rates slows the economy.
Back in the 1970s, Charles Goodhart (an advisor to the Bank of England at the time) formulated Goodhart’s Law:
Any observed statistical regularity will tend to collapse once pressure is placed upon it for control purposes.
Or as it is more commonly related: “When a measure becomes a target, it ceases to be a good measure.”
Does the changing shape of the yield curve mean the same now as it did before government officials – Fed, Treasury – started manipulating it? The move to try and cap long term rates has an obvious target – mortgage rates. The President has been talking about reducing interest rates since he came in to office; that was the whole point of the Jay Powell brow beating. Bessent is trying to deliver for his boss but so far it isn’t working. Long term rates may be lower than they otherwise would be but they are still near the high end of the 4 year range. Short term rates, on the other hand, are higher than they would be otherwise and that has implications for a wide swath of the economy. While large companies can tap the long term bond market, most of the economy relies on shorter term funding. Small business borrowing and consumer loans, such as for automobiles and credit cards, are tied to short term rates.
Higher short term rates have a cost, most likely in slower growth. How much slower I don’t know, but if slower growth turns into a recession – certainly not out of the realm of possibilities – the administration will almost certainly get their desired lower mortgage rates. But lower mortgage rates at the cost of higher unemployment sounds like a bad trade to me.
Careful what you wish for Mr. Treasury Secretary.


Comments
Log in or sign up to join the conversation.