

Since Mondays tend to be busy, I like to start the week with a quick review of the primary cycles (cyclical and secular) and my favorite big-picture market models. So let's get to it.
Primary Cycle Market Models
The key here is to start the week with a clear understanding of what type of market we are dealing with. Note that the primary cycles do not change often. As such, a quick glance at the color of the cycle board and the weekly/monthly S&P graphs below tells you everything you need to know about the "state" of the cycles.
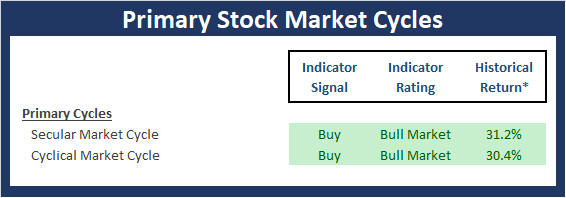
* Source: Ned Davis Research (NDR) as of the date of publication. Historical returns are hypothetical average annual performances calculated by NDR. Past performances do not guarantee future results or profitability - NOT INDIVIDUAL INVESTMENT ADVICE.
The Secular Market Cycle
A secular bull market is defined as a period in which stock prices rise at an above-average rate for an extended period (think 5 years or longer) and suffer only relatively short intervening declines. A secular bear market is an extended period of flat or declining stock prices. Secular bull or bear markets typically consist of multiple cyclical bull and bear markets. Below is a monthly chart of the S&P 500 Index illustrating the current cycle, which we estimate began on March 9, 2009.
S&P 500 - Monthly

The Cyclical Market Cycle
A cyclical bull market requires a 30% rise in the DJIA after 50 calendar days or a 13% rise after 155 calendar days. Reversals of 30% in the Value Line Geometric Index since 1965 also qualify. A cyclical bear market requires a 30% drop in the DJIA after 50 calendar days or a 13% decline after 145 calendar days. Reversals of 30% in the Value Line Geometric Index also qualify. Below is a weekly chart of the S&P 500 illustrating the current cycle, which we estimate began on March 24, 2020.
S&P 500 - Weekly

The Current State of the Primary Cycle Market Models
We have hand selected each model contained in this board. Note that I have utilized several of these models in our daily work for decades. Each of the models is designed to provide a standalone reading of market health and each has a strong historical record of staying on the proper side of the market's primary trend. Taken together, the Primary Cycle Model board is intended to help determine the overall "state of the market."
My Quick Take...
There are no changes to report on the Primary Cycle board once again this week. However, there are a couple nuances worth noting. First, our Leading Indicators model, which was teetering on the edge last week has upticked to a more neutral reading. In addition, our primary Intermediate-Term Market Model also saw some modest improvement. On the negative side of the ledger, our Fundamentals Factors Model lost a component to the dark side but remains solidly neutral overall. And with an hypothetical average return of the market given the current state of the models still well above the historical average, this tells me to continue to give the bulls the benefit of any/all doubt.
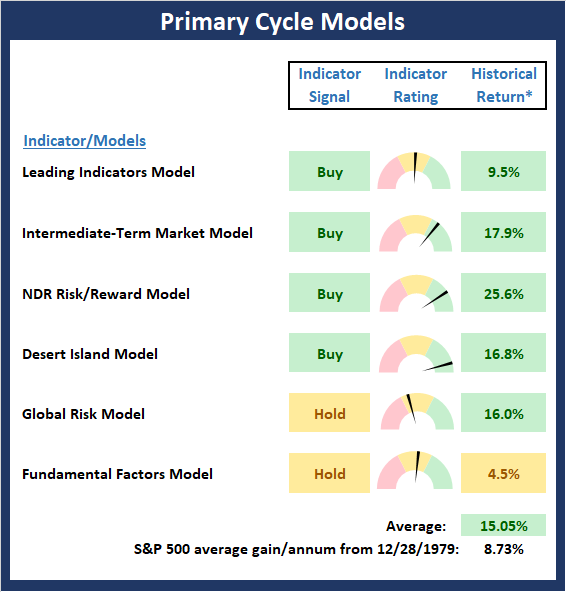
* Source: Ned Davis Research (NDR) as of the date of publication. Historical returns are hypothetical average annual performances calculated by NDR.



Comments
Log in or sign up to join the conversation.