

What are the main fundamentals for crude oil to look at? Russia’s revenues boosted by high oil prices, OPEC+ raising output, dropping US inventories.
On Thursday (June 2), black gold prices rallied more than one percent after US crude reserves dropped more than expected amid higher demand for fuel, despite the OPEC+'s output deal to boost crude oil supplies by 648k barrels per day this summer, instead of its planned 432k) to offset the drop in Russian oil production.
Today, Russia's finance ministry just said it expected to receive 393 billion roubles ($6.35 bn) in additional oil and gas revenue this month.
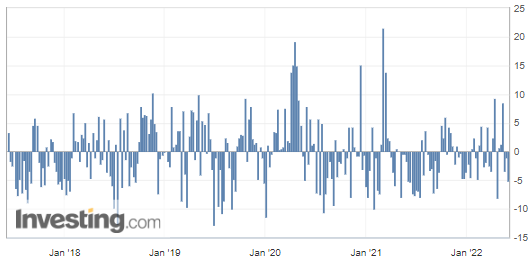
United States Crude Oil Inventories
The weekly commercial crude oil reserves in the United States fell almost four times more than the predictions, according to figures released on Thursday by the US Energy Information Administration (EIA).

US crude inventories have decreased by over five million barrels, which implies greater demand and is considered a bullish factor for crude oil prices. Here, the difference with the forecasted figure is quite high, which is why the increased output from OPEC+ remained in the back.
(Click on image to enlarge)
(Source: Investing.com)
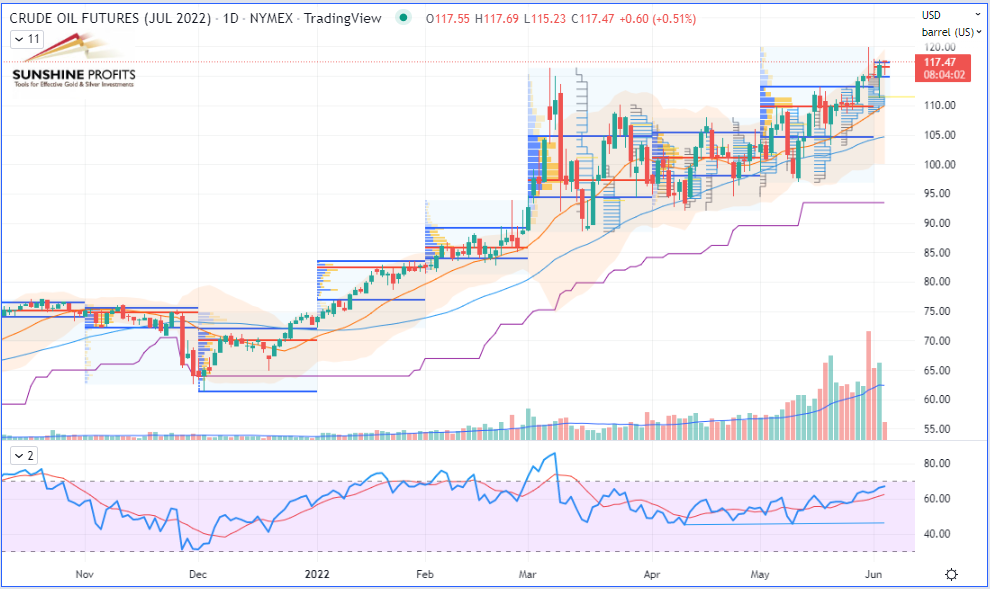
WTI Crude Oil (CLM22) Futures (June contract, daily chart)
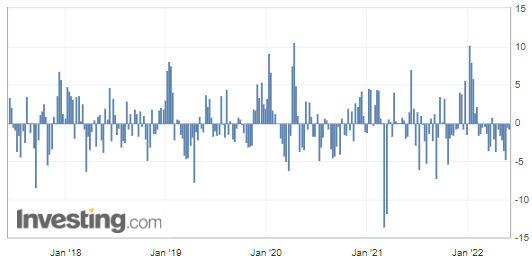
United States Gasoline Inventories
The following are US Gasoline Reserves which were extracted from the same released report:

The above figure confirmed the drop in fuel, which analysts did not expect to drop over a week, so the figure falls into the bullish side as well. Personally, I was mentioning the likeliness of a potential drop in my last analysis from May 26, because of a demand acceleration triggered by the beginning of the Summer Driving Season in the USA.
(Source: Investing.com)
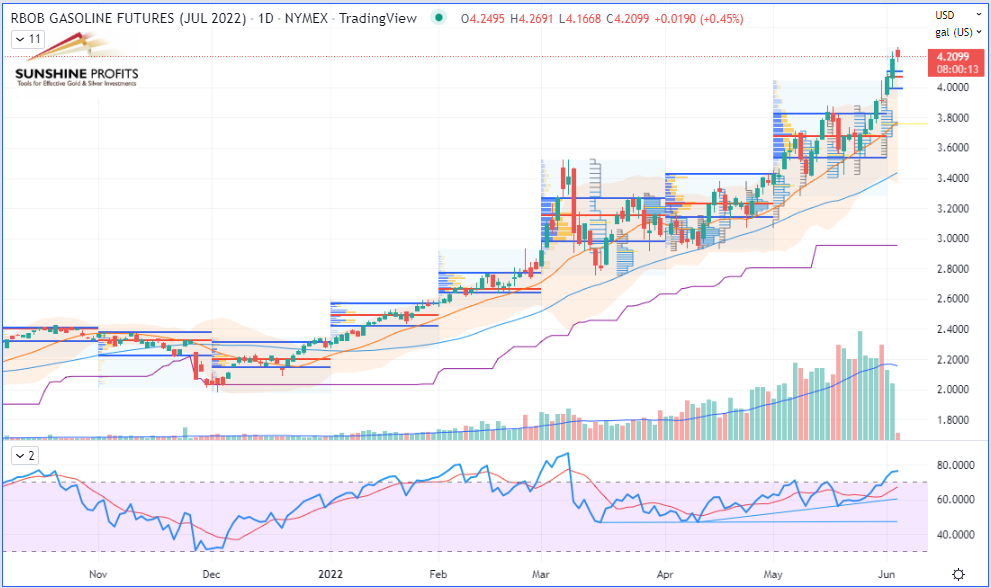
RBOB Gasoline (RBM22) Futures (June contract, daily chart)



Comments
Log in or sign up to join the conversation.