
As with the start of every month, during yesterday and today's session we have seen the release of various macroeconomic data, chief among which is the manufacturing PMI data
Yesterday afternoon, the manufacturing PMI data for the US and the UK was released and today was the turn of Spain, Italy, France, Germany and the Euro zone as a whole. The results were quite varied.
On the one hand, we have those which were better than expected, such as the UK, Italy and France. On the other hand, are those which have had a worse than expected result, such as Spain, Germany and the Euro zone as a whole.
-min.jpg)
The US demonstrated a mixed performance. If we look at the Markit manufacturing PMI versus the US ISM manufacturing PMI, we can see that the former was worse than expected, whereas the latter has exceeded market expectations. We will take this second figure as the more relevant of the two.
The German manufacturing PMI has been worse than expected for the third consecutive month, despite the fact that the preliminary figure published on October 22nd showed a slight improvement. So once again, we can observe the deterioration suffered by the German economy, which is, in turn, dragging down the Euro zone as a whole.
Despite the disappointing macro data, the DAX40 is continuing its positive trend of the last few weeks, bouncing off its important support level whilst volatility has been easing (shown in the ATR indicator).
(Click on image to enlarge)
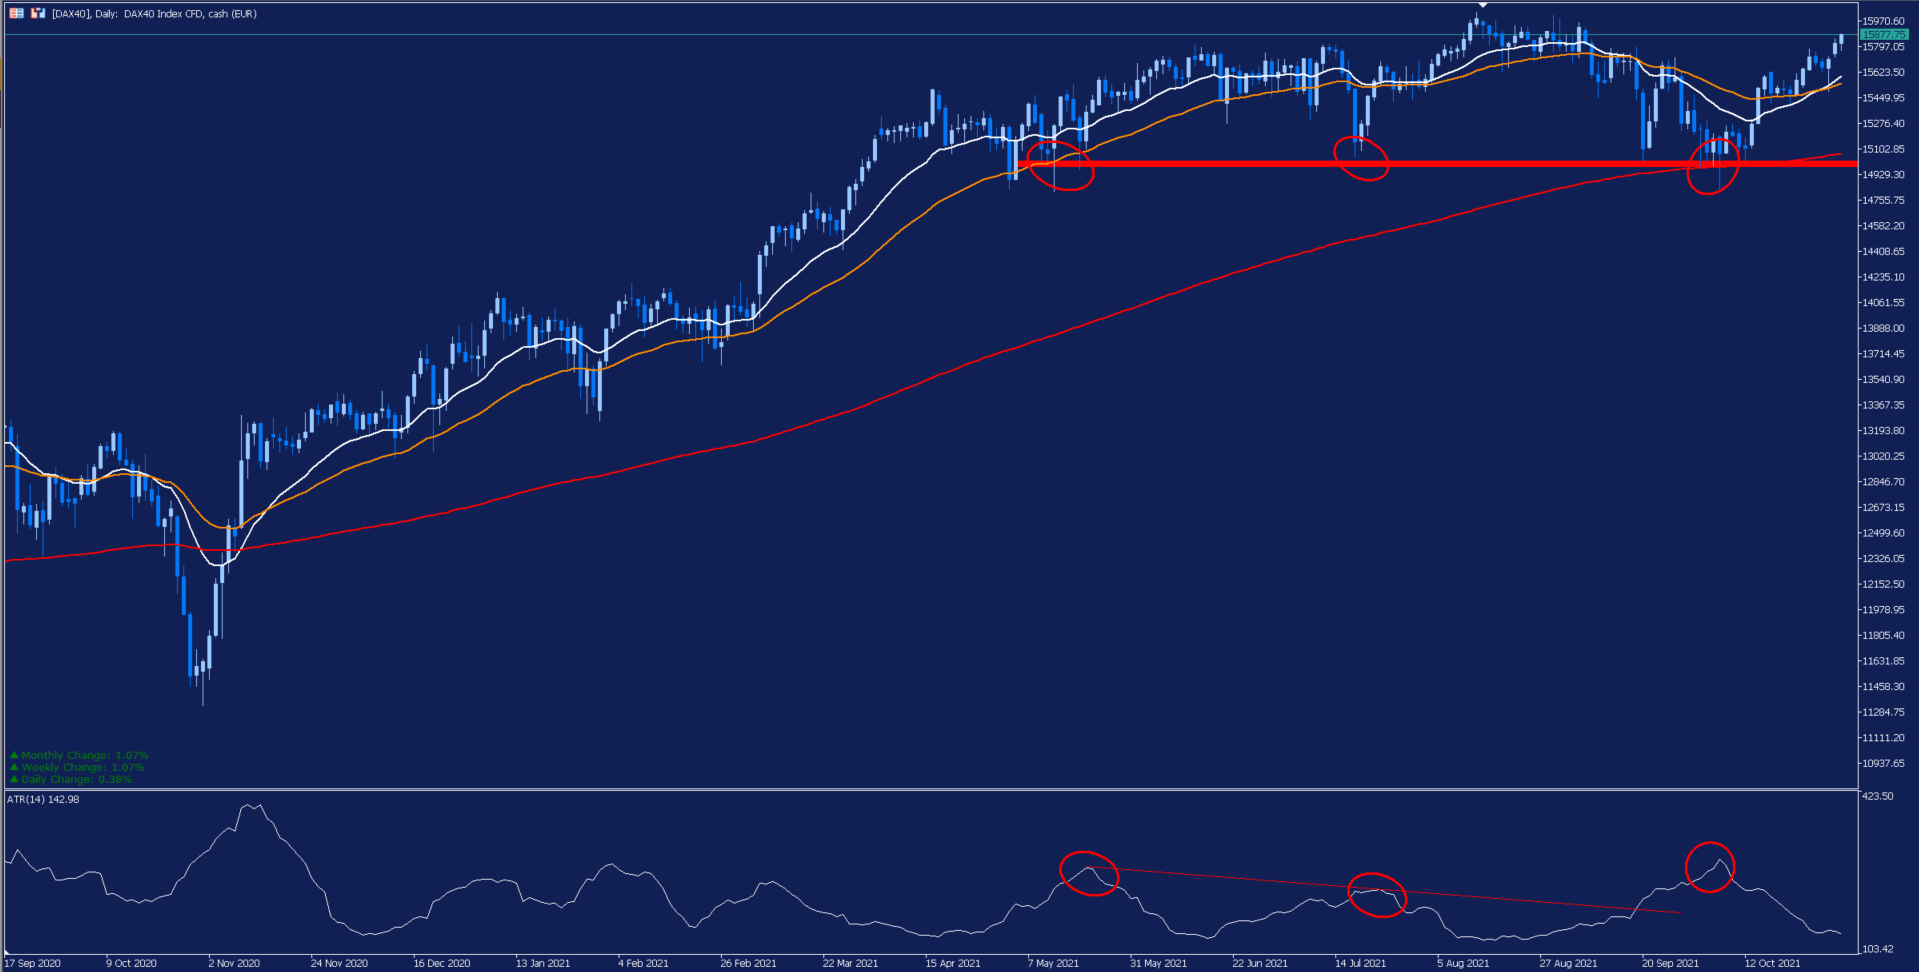
Depicted: Admirals MetaTrader 5 – DAX40 Daily Chart. Date Range: 17 September 2020 – 2 November 2021. Date Captured: 2 November 2021. Past performance is not a reliable indicator of future results.
This rebound is leading the German benchmark to surpass the important level of 15,810 points in the area of the highs of June and July. This breakout could lead the price to seek its historical highs in the area of resistance represented by the green band, despite the accumulated overbought levels that we can see in its stochastic indicator.
It is important to follow the evolution of the price over the next few sessions. If it is able to sustain the current rebound, it could face its all-time highs later in the week. A break of this level could open the door to a strong bullish move.
However, if the price makes a rebound, we may see a correction in search of its first support levels. Although, as long as the price remains above the important support/resistance zone represented by the orange band the sentiment should remain positive.
(Click on image to enlarge)
-min.png)
Depicted: Admirals MetaTrader 5 – DAX40 Daily Chart. Date Range: 17 September 2020 – 2 November 2021. Date Captured: 2 November 2021. Past performance is not a reliable indicator of future results.
Evolution of the last five years:
- 2020: 3.6%
- 2019: 25.48%
- 2018: -18.26%
- 2017: 12.51%
- 2016: 6.87%


Comments
Log in or sign up to join the conversation.