

We are still awaiting news from the United States regarding the negotiations that are taking place between Democrats and Republicans on the debt ceiling. If they do not reach an agreement in the coming days, the United States could face its first default in history, as stated by former Federal Reserve Chairwoman and current Treasury Secretary Janet Yellen.
In the meantime, we continue with the publication of quarterly results, the stand out of which today are the fourth fiscal quarter results of US company Micron, which specializes in the production of chips and semiconductors for storage memories.
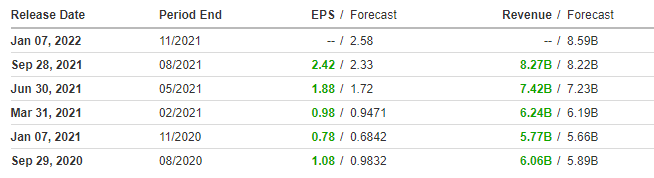
Micron (MU) has once again obtained excellent results, exceeding market expectations both in terms of expected Earnings per Share (EPS) and revenue, as we can see in the following table:
Source: Investing.com
Specifically, Micron reported earnings per share of 2.42 USD and revenue of 8.27 billion USD, compared to the expected 2.33 USD per share and 8.22 billion USD in revenue. Despite this, after these results were announced, the share price lost around 3.57%.
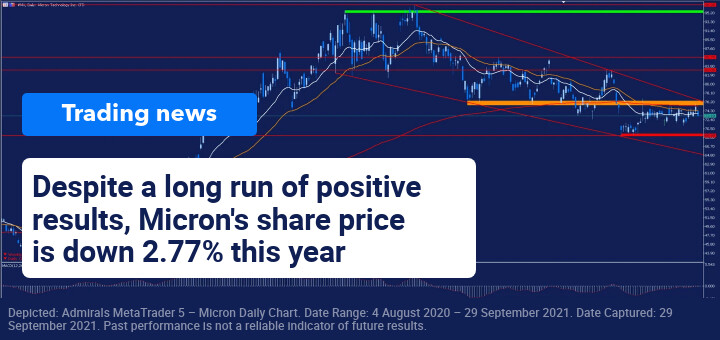
As we can see in its daily chart - after a strong upward trend that led it to set record highs on 12 April 2021, at 96.95 USD per share - the price has followed a downward trend over the last few months that has led it to break several support levels, following a wedge formation, to set annual lows around 69 USD per share.
Despite the good results presented quarter after quarter, the downward trend could be explained by the uncertainty about the results and future prospects due to the crisis caused by the semiconductors and chip production. These declines have caused the company’s share price to decrease 2.77% so far this year, falling more than 23.29% from the aforementioned highs.
The price is currently in an important sideways range, facing the coinciding zone of its 200-session moving average, the orange support/resistance band and the upper band of the wedge formation or bearish trend line - which acts as its first important resistance level, with the lower red band being its main support level.
If it is unable to overcome this important resistance level, the price could make a new downward push towards its support - the loss of which would open the door for a further correction towards the lower band of the wedge formation at around 64 USD per share.
The current resistance level is critical and as long as the price fails to make a sustained bullish breakout from this formation, sentiment will remain negative. A bullish breakout would give the price a boost, although it has to face several important resistance levels before it can think of reaching the highs.
(Click on image to enlarge)
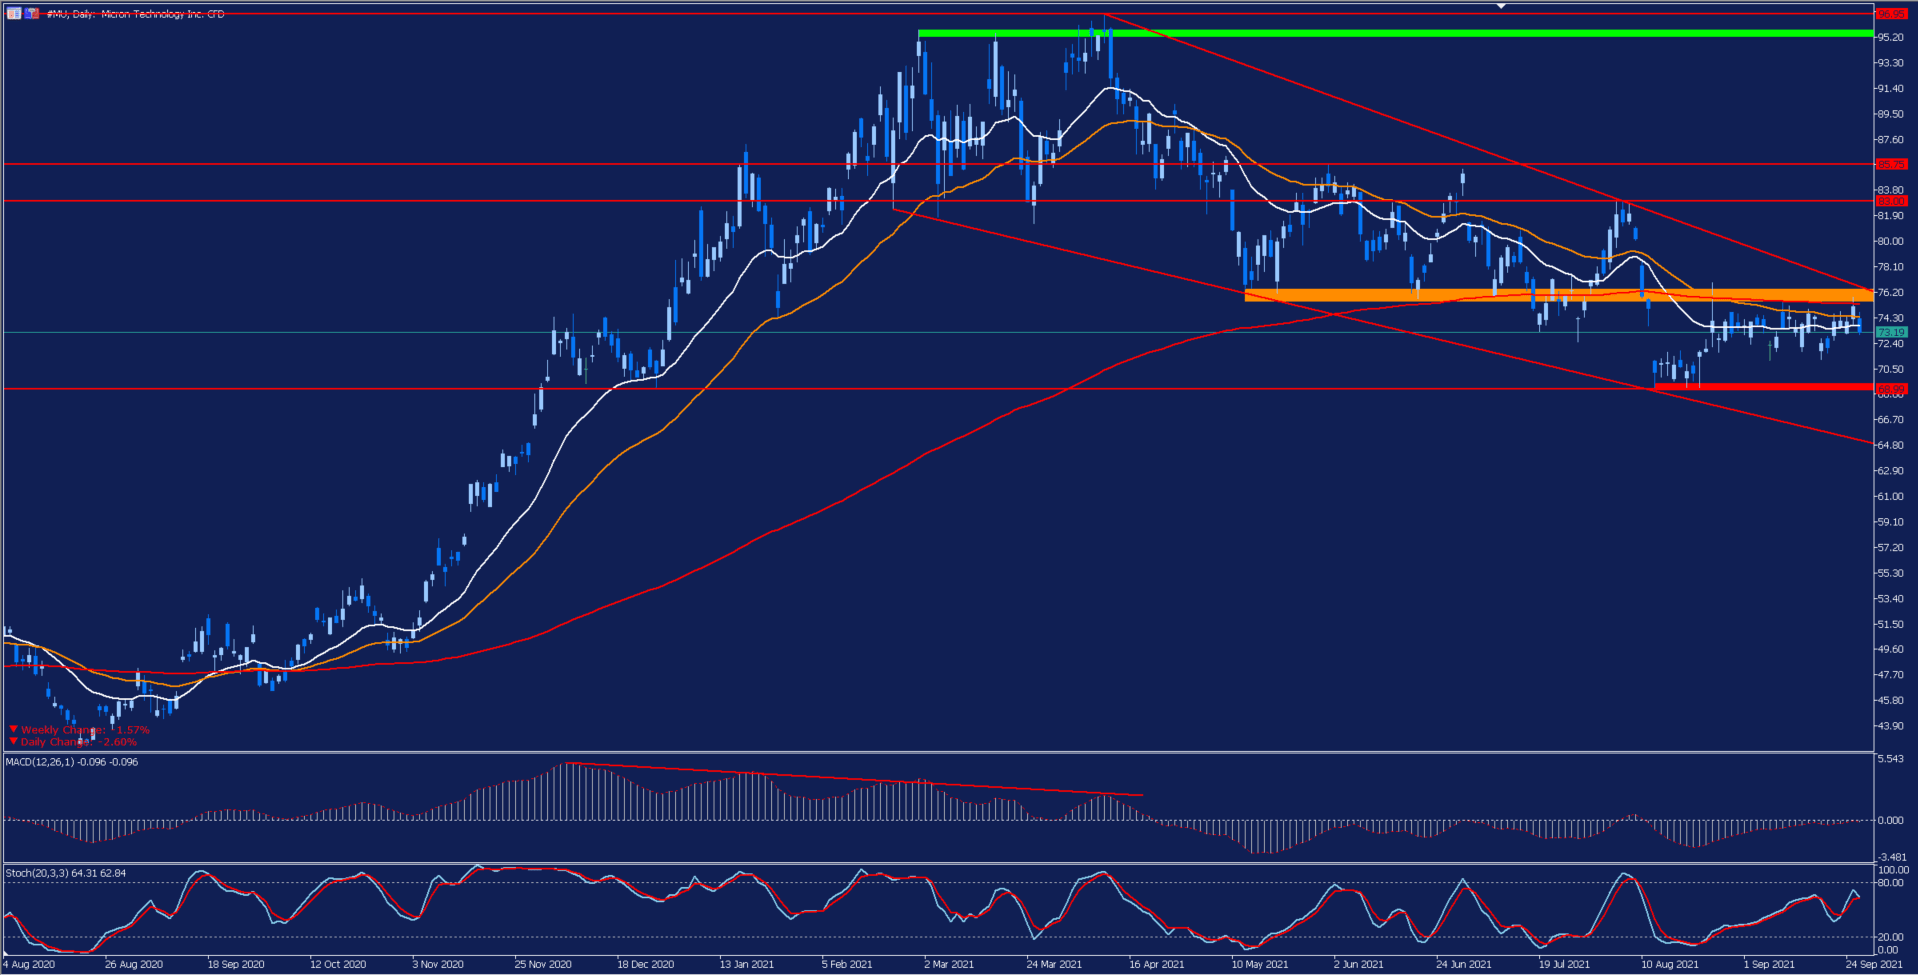
Depicted: Admirals MetaTrader 5 – Micron Daily Chart. Date Range: 4 August 2020 – 29 September 2021. Date Captured: 29 September 2021. Past performance is not a reliable indicator of future results.
Evolution of the last five years:
- 2020: 39.79%
- 2019: 69.49%
- 2018: -22.84%
- 2017: 87.59%
- 2016: 54.80%



Comments
Log in or sign up to join the conversation.