
The December Preliminary Report came in at 70.4, up 3.0 (4.5%) from the November Final. Investing.com had forecast 67.1. Since its beginning in 1978, consumer sentiment is 18.1 percent below the average reading (arithmetic mean) and 17.2 percent below the geometric mean.
Surveys of Consumers chief economist, Richard Curtin, makes the following comments:
Sentiment posted a small overall gain in early December (+4.5%), although it was still nearly identical to the average reading in the prior four months (70.6). The more interesting result was the large disparity between monthly gain among households with incomes in the lowest third (+23.6%) of the income distribution compared with the modest losses among households in the middle (-3.8%) and top third (-4.3%). While small differences in the direction of change are rather common, it is quite unusual to record such a large change in the bottom third: a larger one-month percentage was recorded only once before, a gain of 29.2% in June 1980. While it is usually assumed that such extreme changes represent an erroneous result due to small samples, in 1980 it was the households in the bottom income third that initially signaled the end of the first part of the double recession in 1980-82, with upper income households following in subsequent months. The core of the renewed optimism among the bottom third was the expectation of income increases of 2.9% during the year ahead; the last time a higher gain for this group was expected was in 1981. This suggests an emerging wage-price spiral that could propel inflation higher in the years ahead. When directly asked whether inflation or unemployment was the more serious problem facing the nation, 76% selected inflation while just 21% selected unemployment (the balance reported the problems were equal or they couldn't choose). The dominance of inflation over unemployment was true for all income, age, education, region, and political subgroups. While a shift in policy emphasis is necessary, it will be difficult to gauge the right balance between fiscal and monetary policies that both trims inflation and maintains the unemployment rate near its current lows.
The pandemic recession had an impact on personal finances like no other crisis in more than a half century. While consumers' evaluations of their current and prospective financial situation have both declined, for the first time there has been a substantial gap between the two assessments. The decline in how consumers have judged their current financial situation was half as large as the decline in how they judged their future financial prospects (see the chart). The split is presumably due to the impact of the cash stimulus and unemployment payments. Future financial evaluations have been lessened primarily by rising inflation as nearly half of all consumers expect falling inflation-adjusted incomes during the year ahead. This divergence provided financial support to the holiday spending spree, but in the months ahead many may turn their focus to changes in wages and prices. The inflationary erosion of living standards are currently reported by one-in-four households, and those inflationary driven cutbacks have continued to spread to middle age, middle income, and middle educational groups. [More...]
See the chart below for a long-term perspective on this widely watched indicator. Recessions and real GDP are included to help us evaluate the correlation between the Michigan Consumer Sentiment Index and the broader economy.
(Click on image to enlarge)
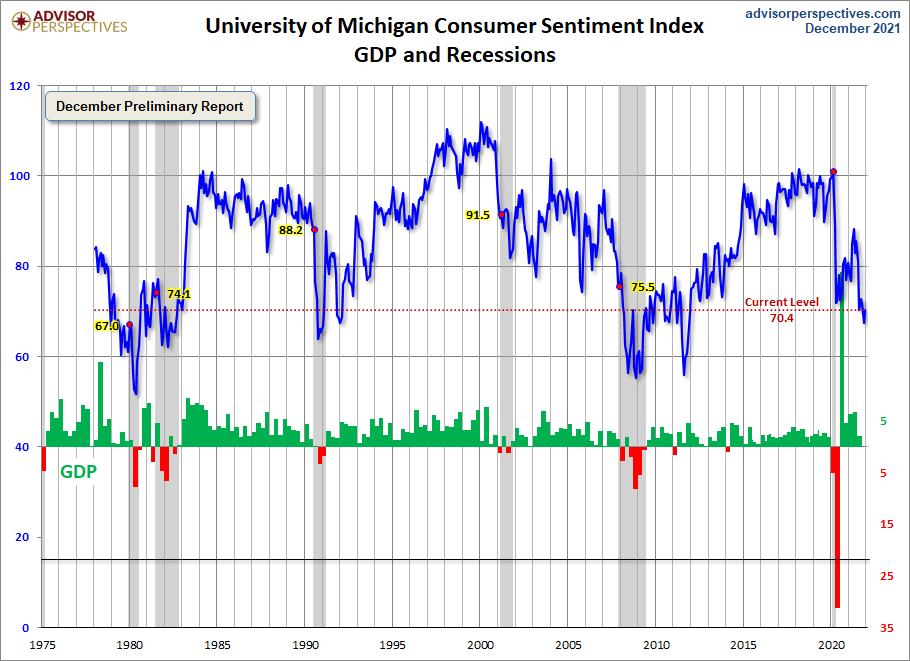
To put today's report into the larger historical context since its beginning in 1978, consumer sentiment is 18.1 percent below the average reading (arithmetic mean) and 17.2 percent above the geometric mean. The current index level is at the
14th percentile of the 528 monthly data points in this series.
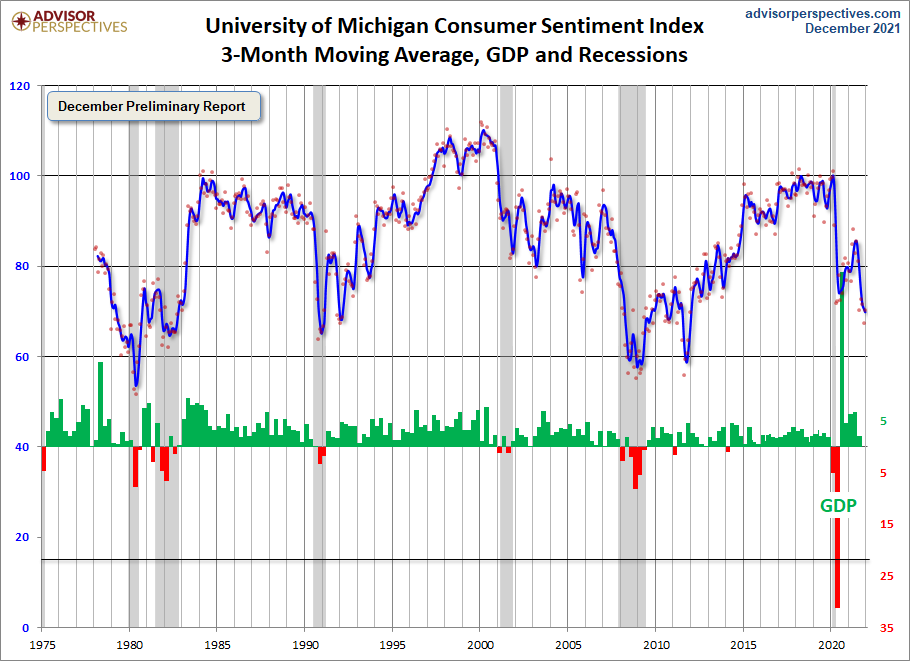
Note that this indicator is somewhat volatile, with a 3.0 point absolute average monthly change. The latest data point saw a 3.0 point increase from the previous month. For a visual sense of the volatility, here is a chart with the monthly data and a three-month moving average.
(Click on image to enlarge)
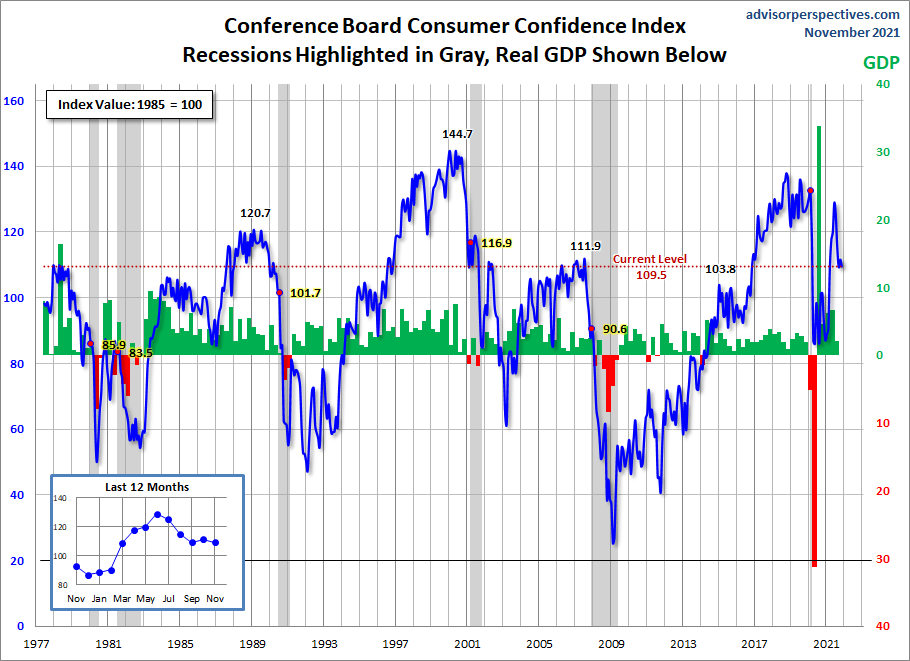
For the sake of comparison, here is a chart of the Conference Board's Consumer Confidence Index (monthly update here). The Conference Board Index is the more volatile of the two, but the broad pattern and general trends have been remarkably similar to the Michigan Index.
(Click on image to enlarge)
And finally, the prevailing mood of the Michigan survey is also similar to the mood of small business owners, as captured by the NFIB Business Optimism Index (monthly update here).
(Click on image to enlarge)


Comments
Log in or sign up to join the conversation.