

The July Preliminary came in at 98.4, down 0.2 from the June Final reading. Investing.com had forecast 98.6.
Surveys of Consumers chief economist, Richard Curtin, makes the following comments:
Consumer sentiment remained largely unchanged in early July from June, remaining at quite favorable levels since the start of 2017. Moreover, the variations in Sentiment Index have been remarkably small, ranging from 91.2 to 101.4 in the past 30 months. Perhaps the most interesting change in the July survey was in inflation expectations, with the year-ahead rate slightly lower and the longer term rate moving to the top of the narrow range it has traveled in the past few years. Given the heightened interest in Fed policy, it is of some interest to examine the relationship between consumers’ inflation expectations and the anticipated strength in the economy as well as prospective shifts in interest rates and unemployment. Inflation expectations were divided into three groups based on responses to the January to July 2019 surveys: those who expected a year-ahead inflation rate less than or equal to 0%, an inflation rate of 1% to 3%, and those who expected an inflation rate equal to or greater than 4% (see the chart). The Consumer Expectations Index falls as inflation expectations rise, signifying that consumers view higher inflation as a threat to economic growth. Higher inflation was related more frequently to rising interest rates and was associated with higher unemployment expectations. While the inflation-unemployment relationship is in the opposite direction of the Phillips curve hypothesis, that relationship is usually based on wage inflation, not overall inflation. Consumers’ views appear to be more consistent with the stagflation thesis, which holds that inflation and unemployment move in the same direction. This thesis is more consistent with how consumers process and organize diverse bits of news about the economy. [More...]
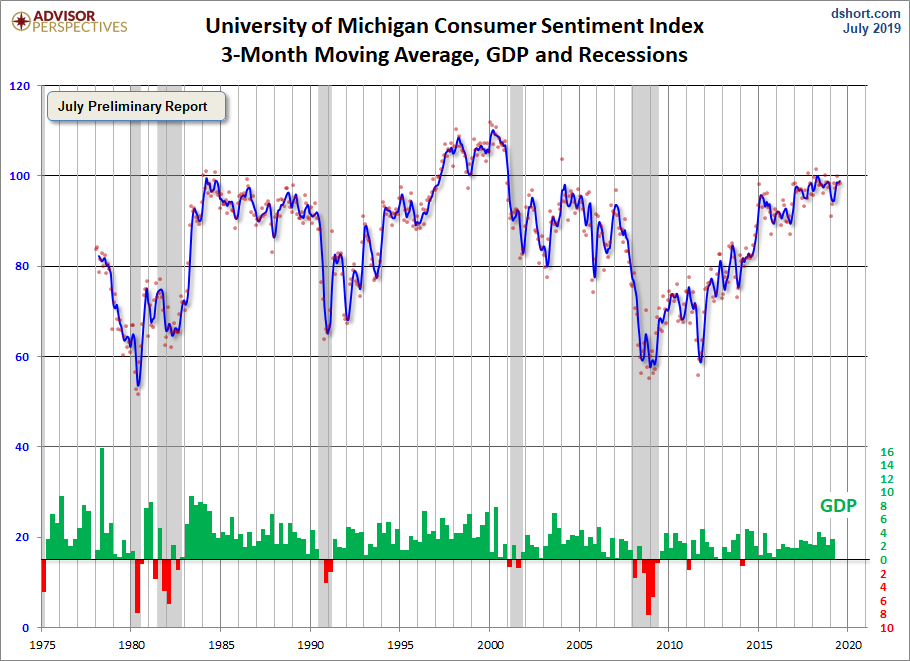
See the chart below for a long-term perspective on this widely watched indicator. Recessions and real GDP are included to help us evaluate the correlation between the Michigan Consumer Sentiment Index and the broader economy.

To put today's report into the larger historical context since its beginning in 1978, consumer sentiment is 14.1 percent above the average reading (arithmetic mean) and 15.4 percent above the geometric mean. The current index level is at the 87th percentile of the 499 monthly data points in this series.
Note that this indicator is somewhat volatile, with a 3.0 point absolute average monthly change. The latest data point saw a 0.2 point increase from the previous month. For a visual sense of the volatility, here is a chart with the monthly data and a three-month moving average.
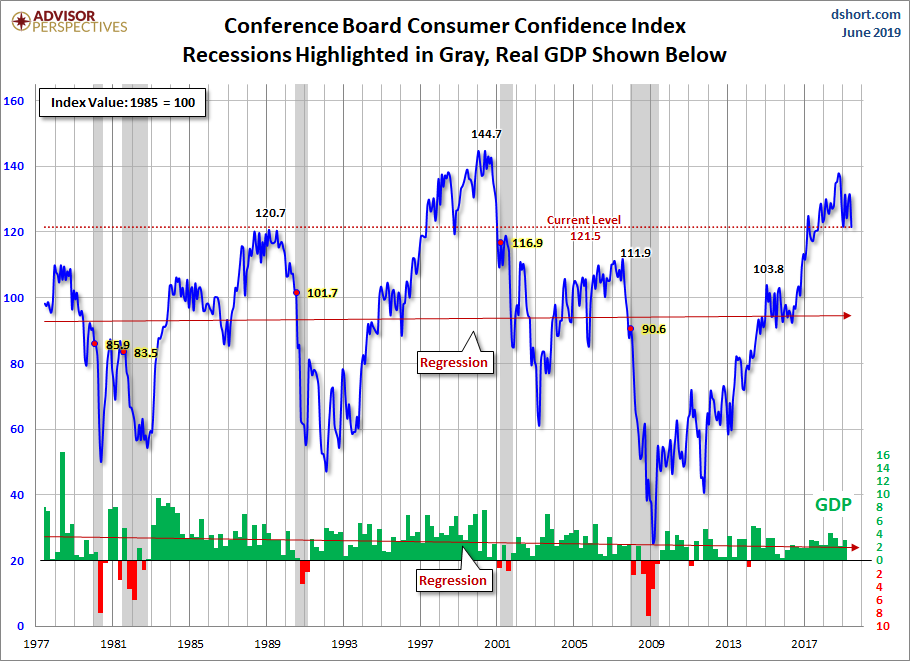
For the sake of comparison, here is a chart of the Conference Board's Consumer Confidence Index (monthly update here). The Conference Board Index is the more volatile of the two, but the broad pattern and general trends have been remarkably similar to the Michigan Index.
And finally, the prevailing mood of the Michigan survey is also similar to the mood of small business owners, as captured by the NFIB Business Optimism Index (monthly update here).
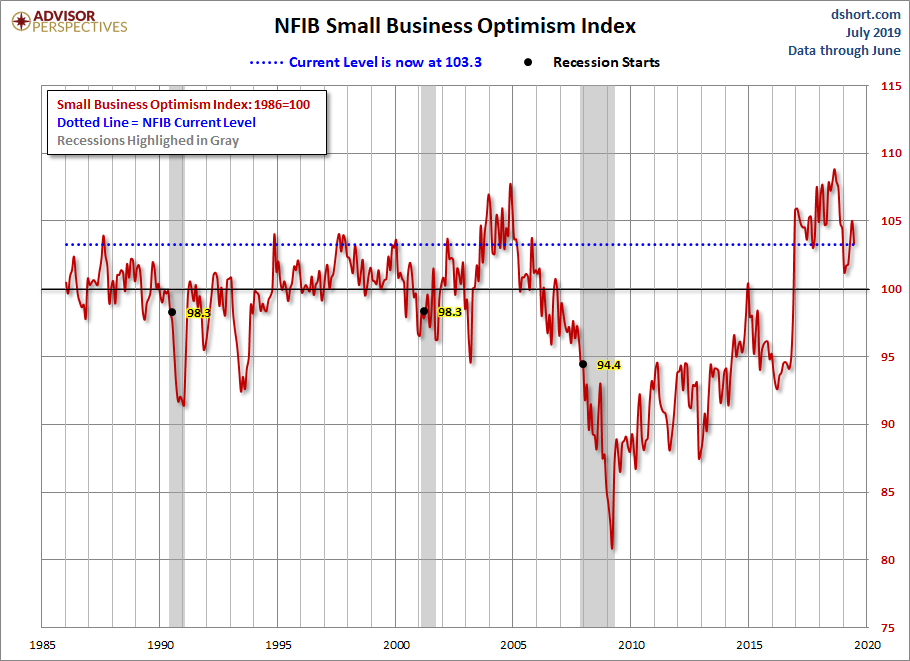
The general trend in the Michigan Sentiment Index since the Financial Crisis lows was one of slow improvement. The survey findings have neared the pre-recession peak.



Comments
Log in or sign up to join the conversation.