

The April Final came in at 97.2, down 1.2 from the March Final reading. Investing.com had forecast 97.1.
Surveys of Consumers chief economist, Richard Curtin, makes the following comments:
The Index of Consumer Sentiment has moved sideways, recording only small monthly variations since Trump first entered office. The Sentiment Index has averaged 97.2 in the past 28 months, identical to the April 2019 reading. Moreover, the Sentiment Index has remained between 95.0 and 99.0 for 21 of the past 28 months. Variations within plus or minus 2.0 percentage points for the Sentiment Index meant that most of the monthly changes were statistically insignificant. The last time consumer sentiment was as favorable for as long a period of time was during the late stages of the Clinton expansion. When asked about their financial prospects for the year ahead, 44% of consumers anticipated improvements compared with just 8% who expected worsening finances. This was the best overall reading since 2004 (see the chart). Moreover, when asked about longer term financial prospects, 60% reported in the April survey that they expected to be better off financially over the next five years. This was the highest proportion ever recorded, although the question was only asked sporadically from 1979 to 1985 and then consistently from 2011 onwards. Overall, the data indicate that inflation-adjusted personal consumption expenditures will grow by 2.5% in 2019. [More...]
See the chart below for a long-term perspective on this widely watched indicator. Recessions and real GDP are included to help us evaluate the correlation between the Michigan Consumer Sentiment Index and the broader economy.
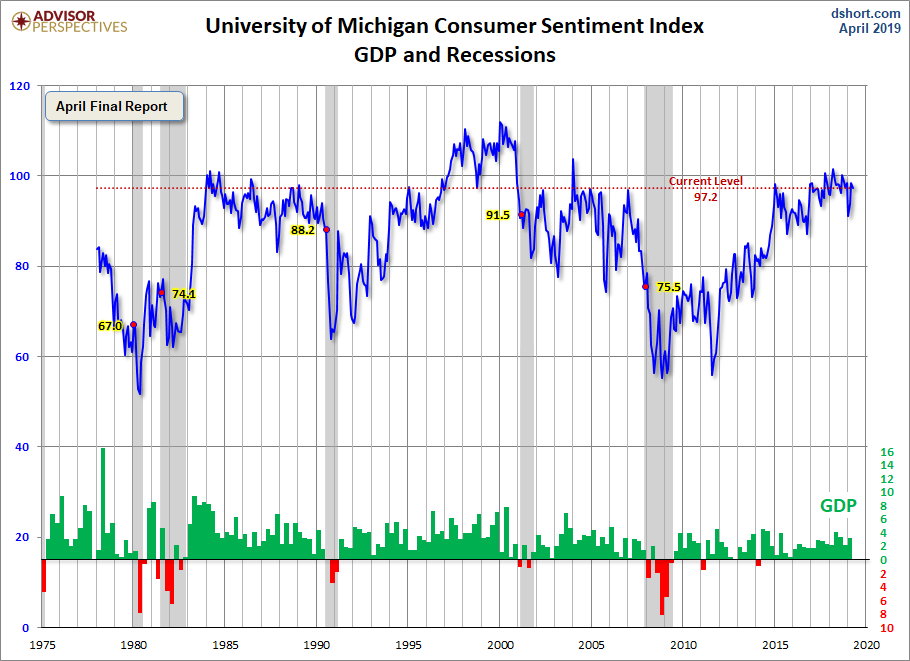
To put today's report into the larger historical context since its beginning in 1978, consumer sentiment is 12.8 percent above the average reading (arithmetic mean) and 14.1 percent above the geometric mean. The current index level is at the 84th percentile of the 496 monthly data points in this series.
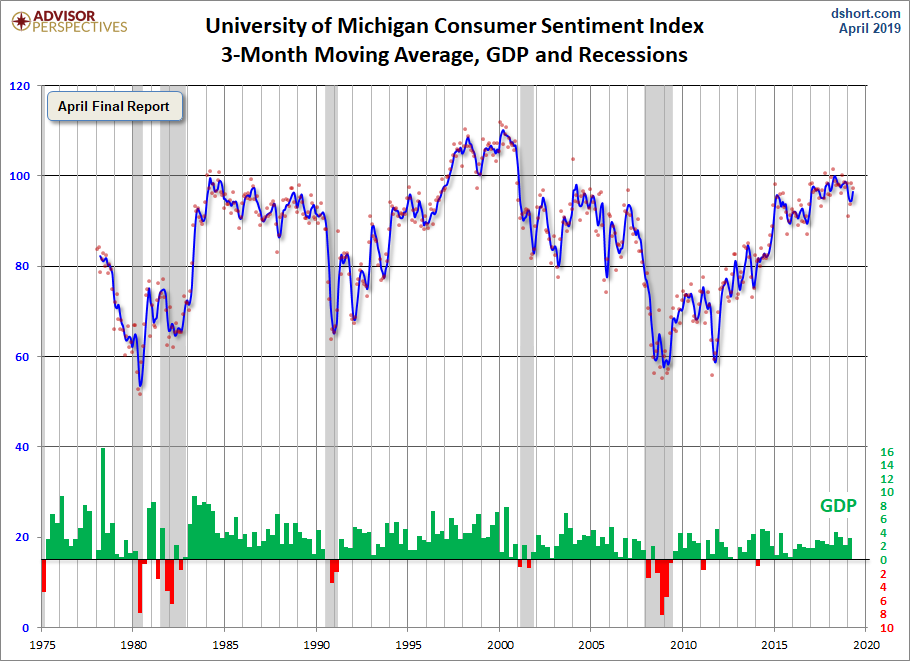
Note that this indicator is somewhat volatile, with a 3.0 point absolute average monthly change. The latest data point saw a 1.2 point increase from the previous month. For a visual sense of the volatility, here is a chart with the monthly data and a three-month moving average.
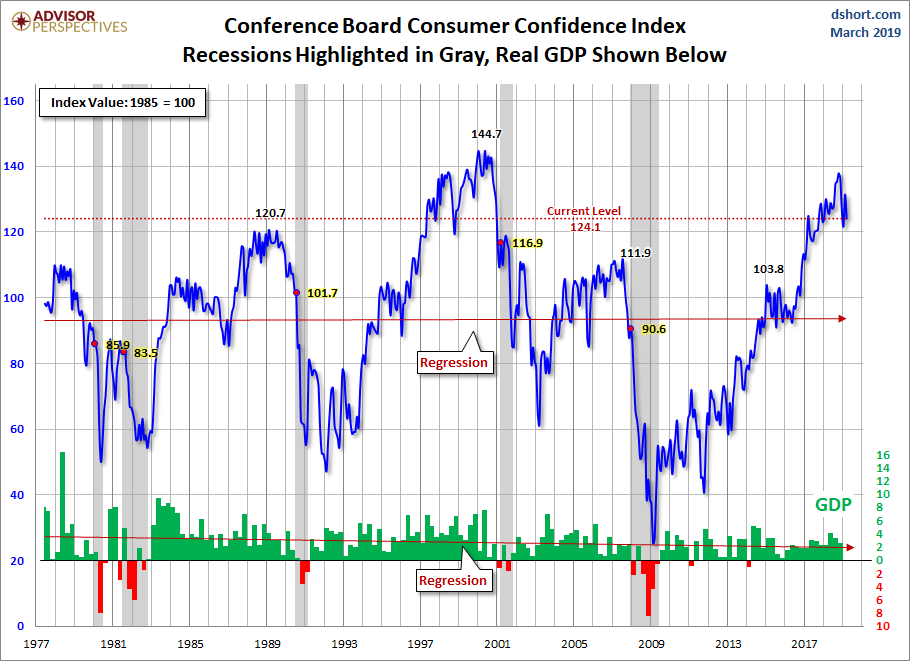
For the sake of comparison, here is a chart of the Conference Board's Consumer Confidence Index (monthly update here). The Conference Board Index is the more volatile of the two, but the broad pattern and general trends have been remarkably similar to the Michigan Index.
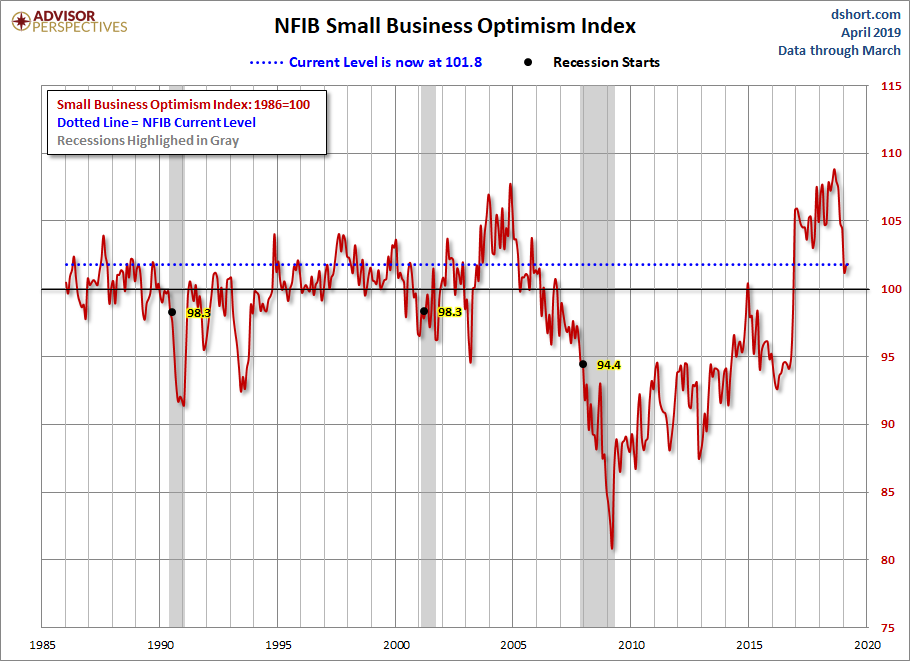
And finally, the prevailing mood of the Michigan survey is also similar to the mood of small business owners, as captured by the NFIB Business Optimism Index (monthly update here).
The general trend in the Michigan Sentiment Index since the Financial Crisis lows was one of slow improvement. The survey findings saw a jump in late 2016 with improvements that have recently begun to decline.
The next update to this report will be for the May preliminary data and will be published May 17th.



Comments
Log in or sign up to join the conversation.