

The March Final Report came in at 59.4, down 3.4 (5.4%) from the February Final. Investing.com had forecast 59.7. Since its beginning in 1978, consumer sentiment is 30.8 percent below the average reading (arithmetic mean) and 30.0 percent below the geometric mean.
Surveys of Consumers chief economist, Richard Curtin, makes the following comments:
Consumer Sentiment remained largely unchanged in late March at the same diminished level recorded at mid month. Inflation has been the primary cause of rising pessimism, with an expected year-ahead inflation rate at 5.4%, the highest since November 1981. Inflation was mentioned throughout the survey, whether the questions referred to personal finances, prospects for the economy, or assessments of buying conditions. When asked to explain changes in their finances in their own words, more consumers mentioned reduced living standards due to rising inflation than any other time except during the two worst recessions in the past fifty years: from March 1979 to April 1981, and from May to October 2008. Moreover, 32% of all consumers expected their overall financial position to worsen in the year ahead, the highest recorded level since the surveys started in the mid-1940s. The combination of rising prices and less positive income expectations meant that half of all households anticipated declines in inflation-adjusted incomes in the year ahead. The sole area of the economy about which consumers were still optimistic was the strong job market. Consumers anticipated in March that during the year ahead it was more likely that the unemployment rate would post further declines than increases (30% versus 24%).
See the chart below for a long-term perspective on this widely watched indicator. Recessions and real GDP are included to help us evaluate the correlation between the Michigan Consumer Sentiment Index and the broader economy.
(Click on image to enlarge)
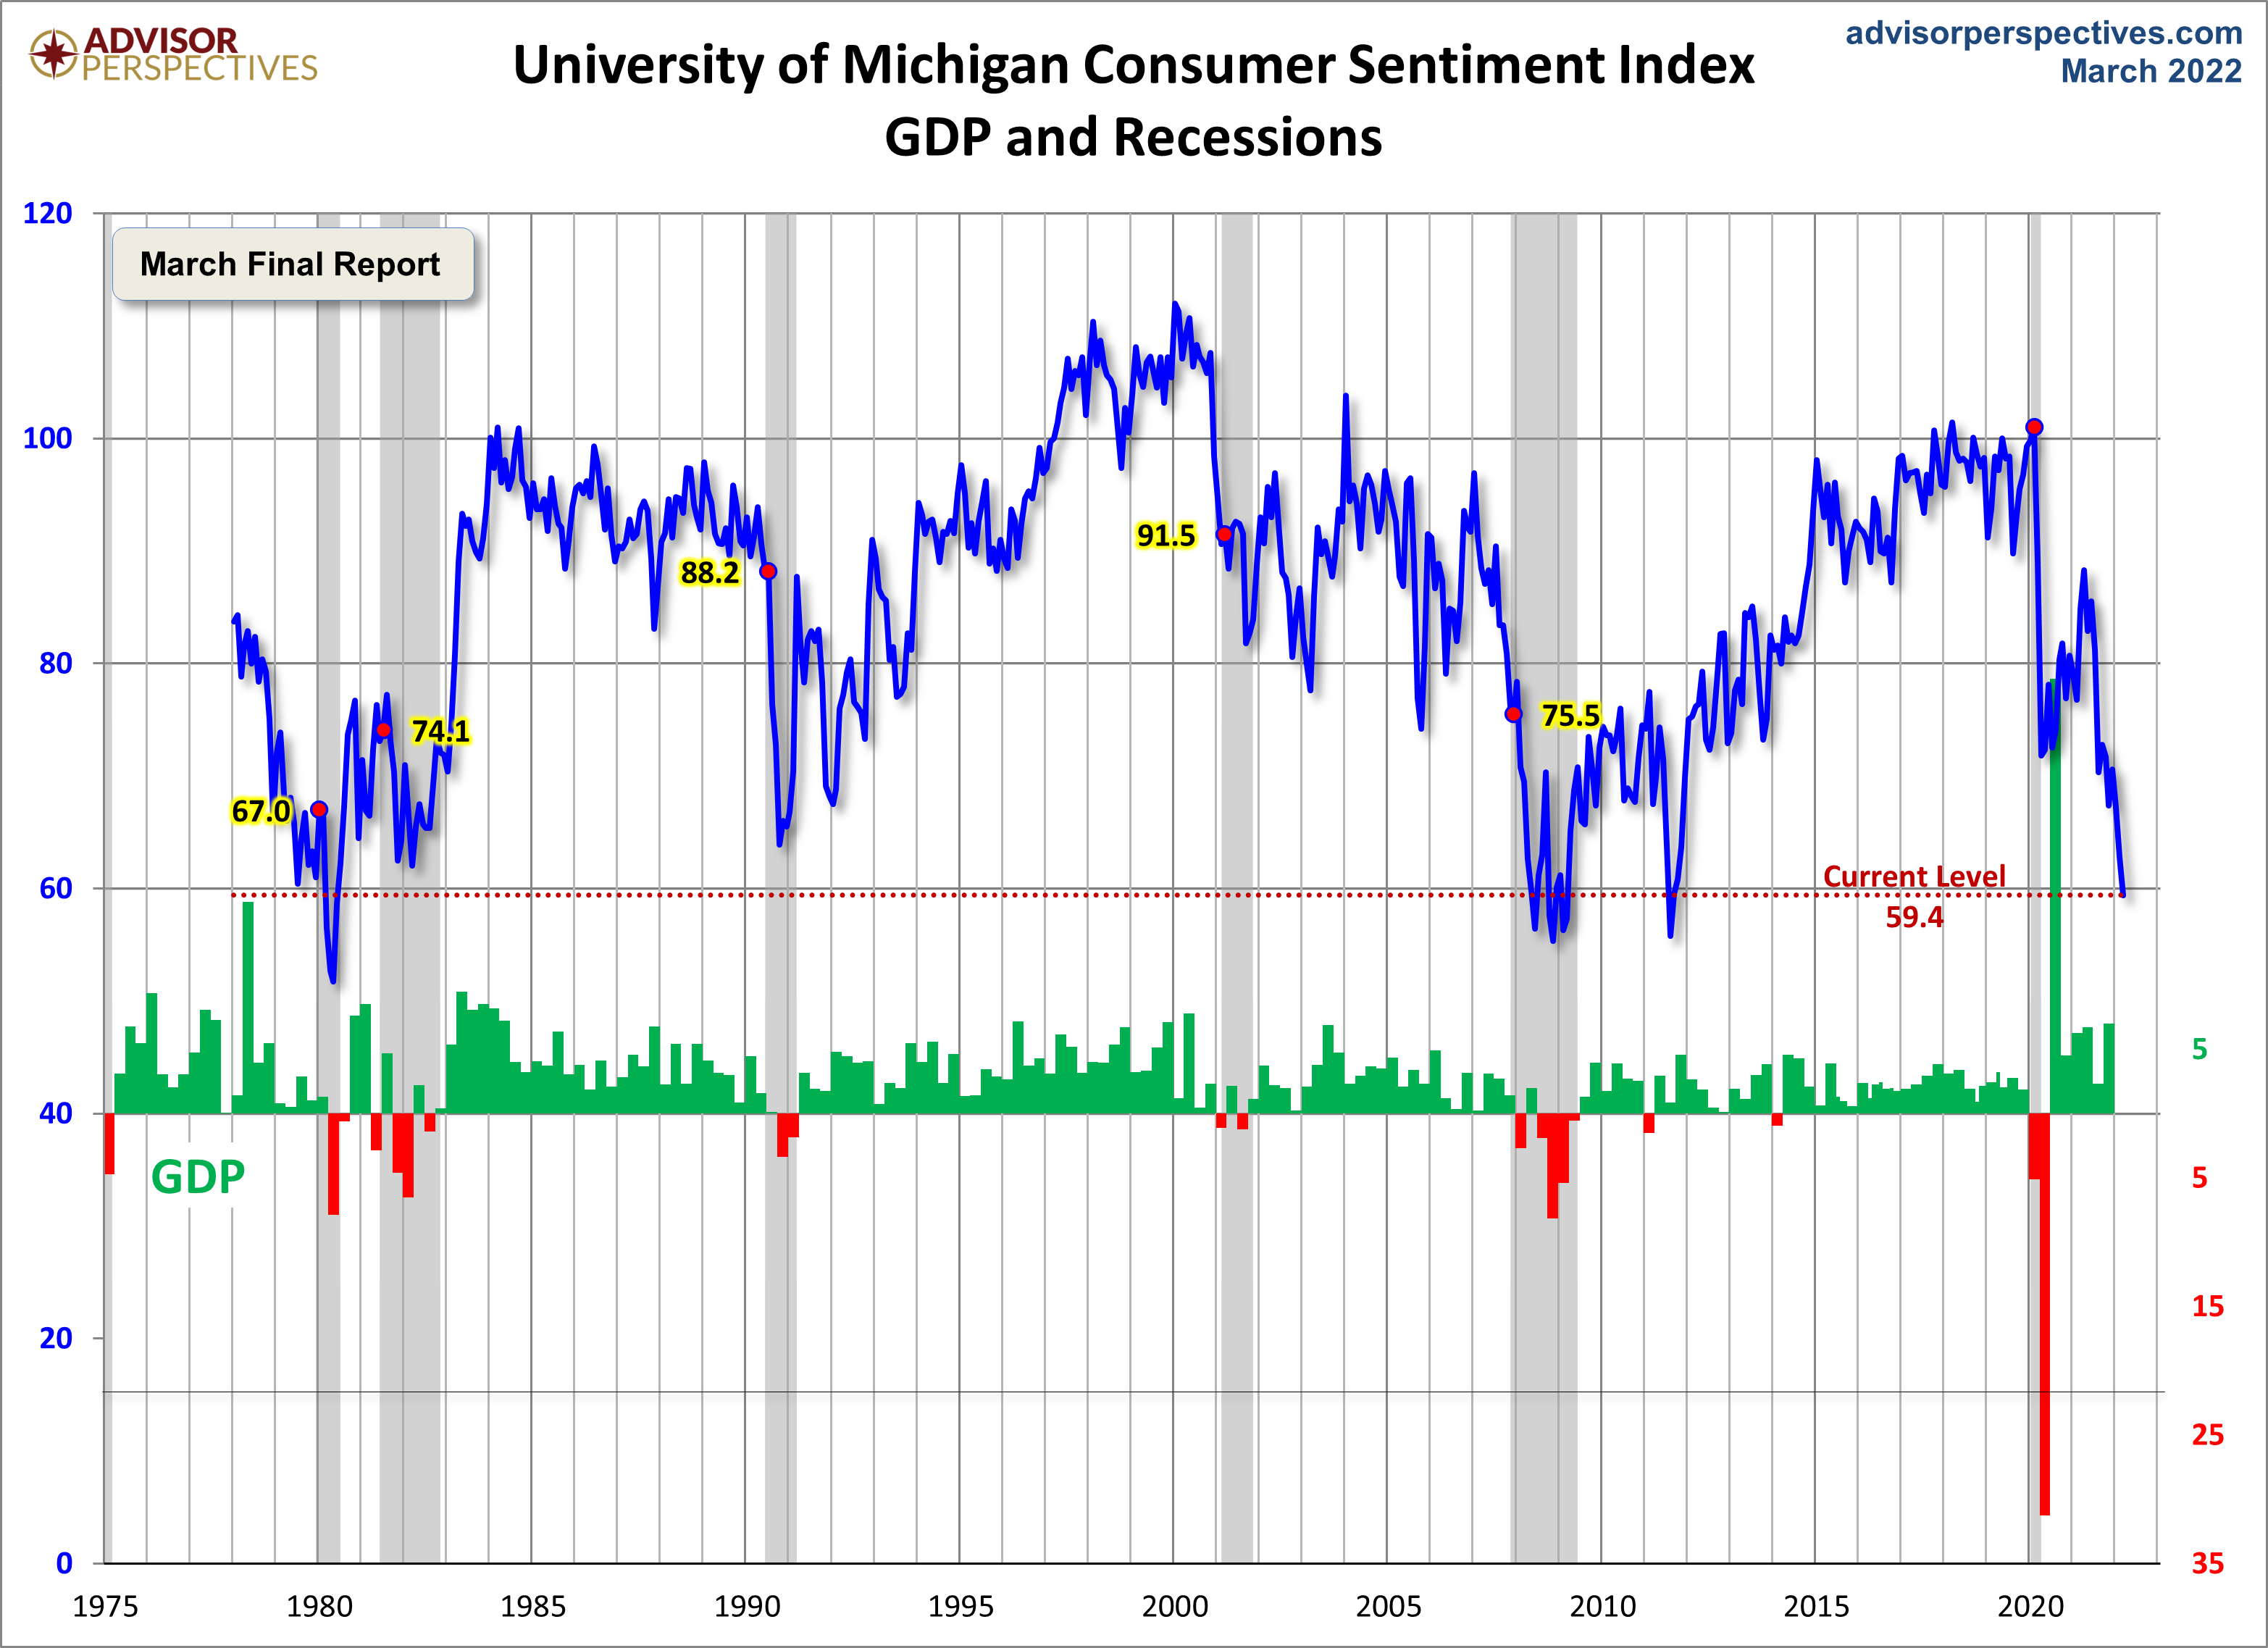
To put today's report into the larger historical context since its beginning in 1978, consumer sentiment is 30.8 percent below the average reading (arithmetic mean) and 30.0 percent below the geometric mean. The current index level is at the 2nd percentile of the 531 monthly data points in this series.
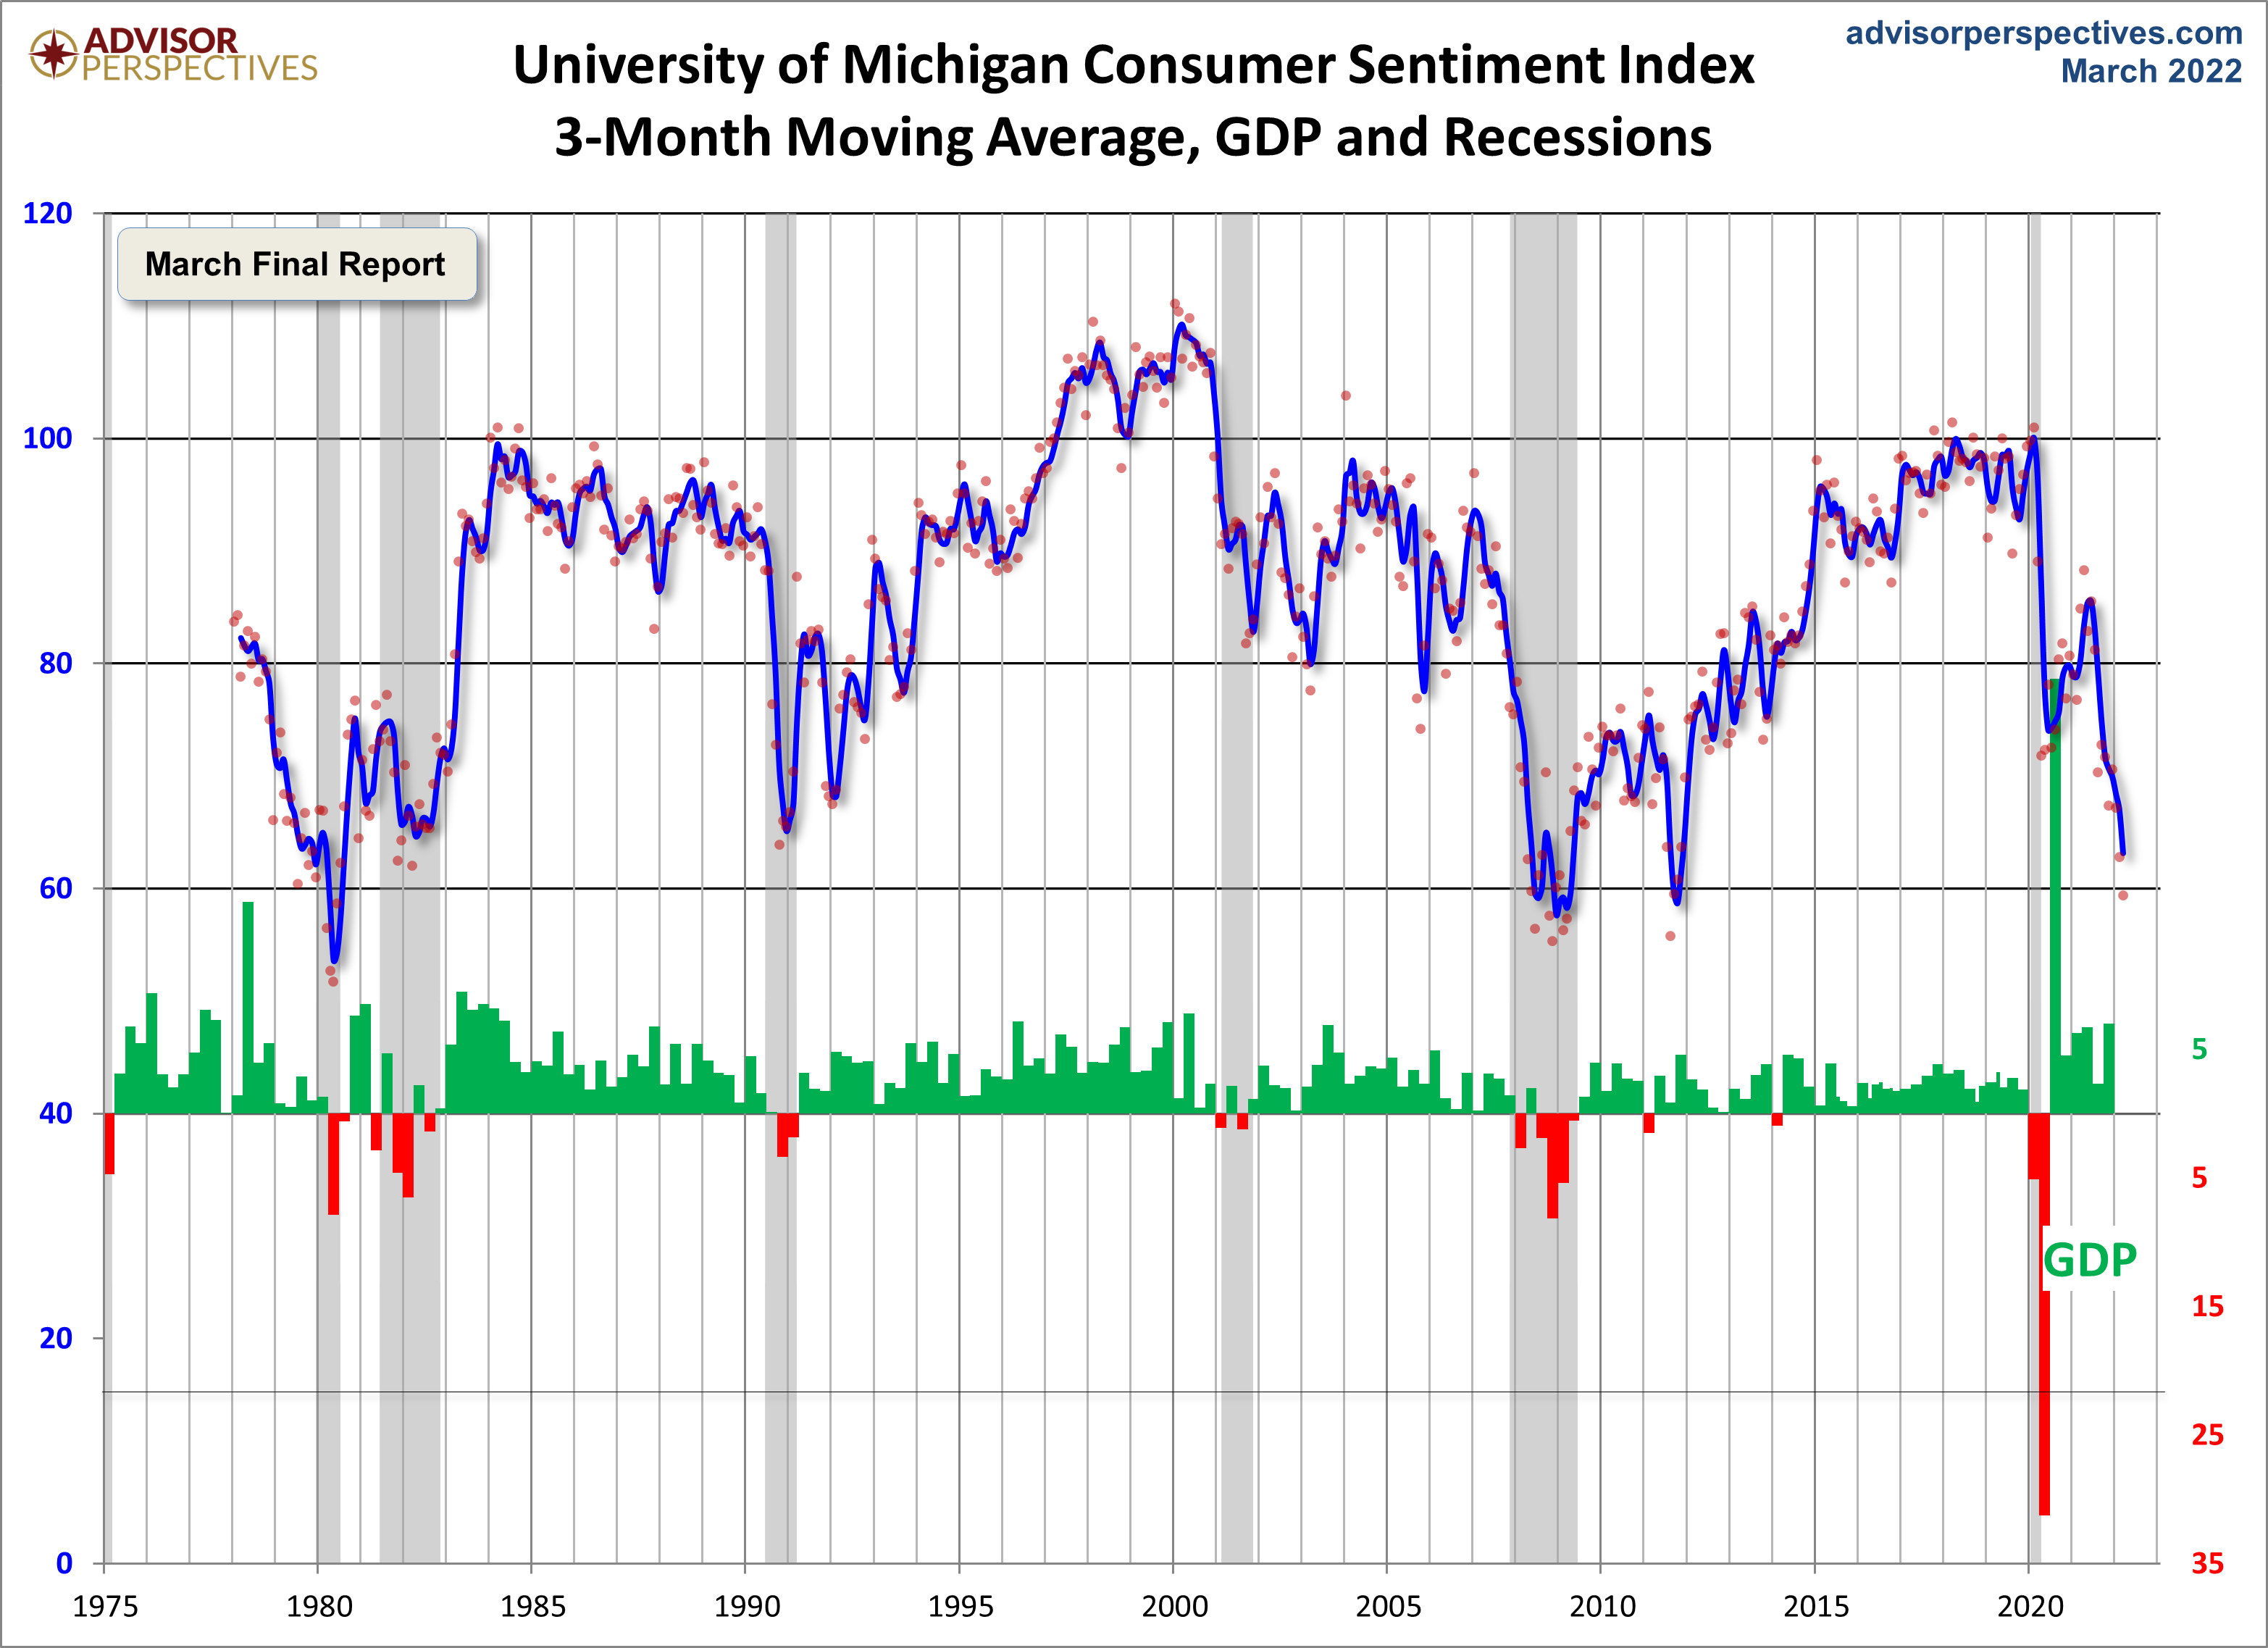
Note that this indicator is somewhat volatile, with a 3.0 point absolute average monthly change. The latest data point saw a 3.4 point decrease from the previous month. For a visual sense of the volatility, here is a chart with the monthly data and a three-month moving average.
(Click on image to enlarge)
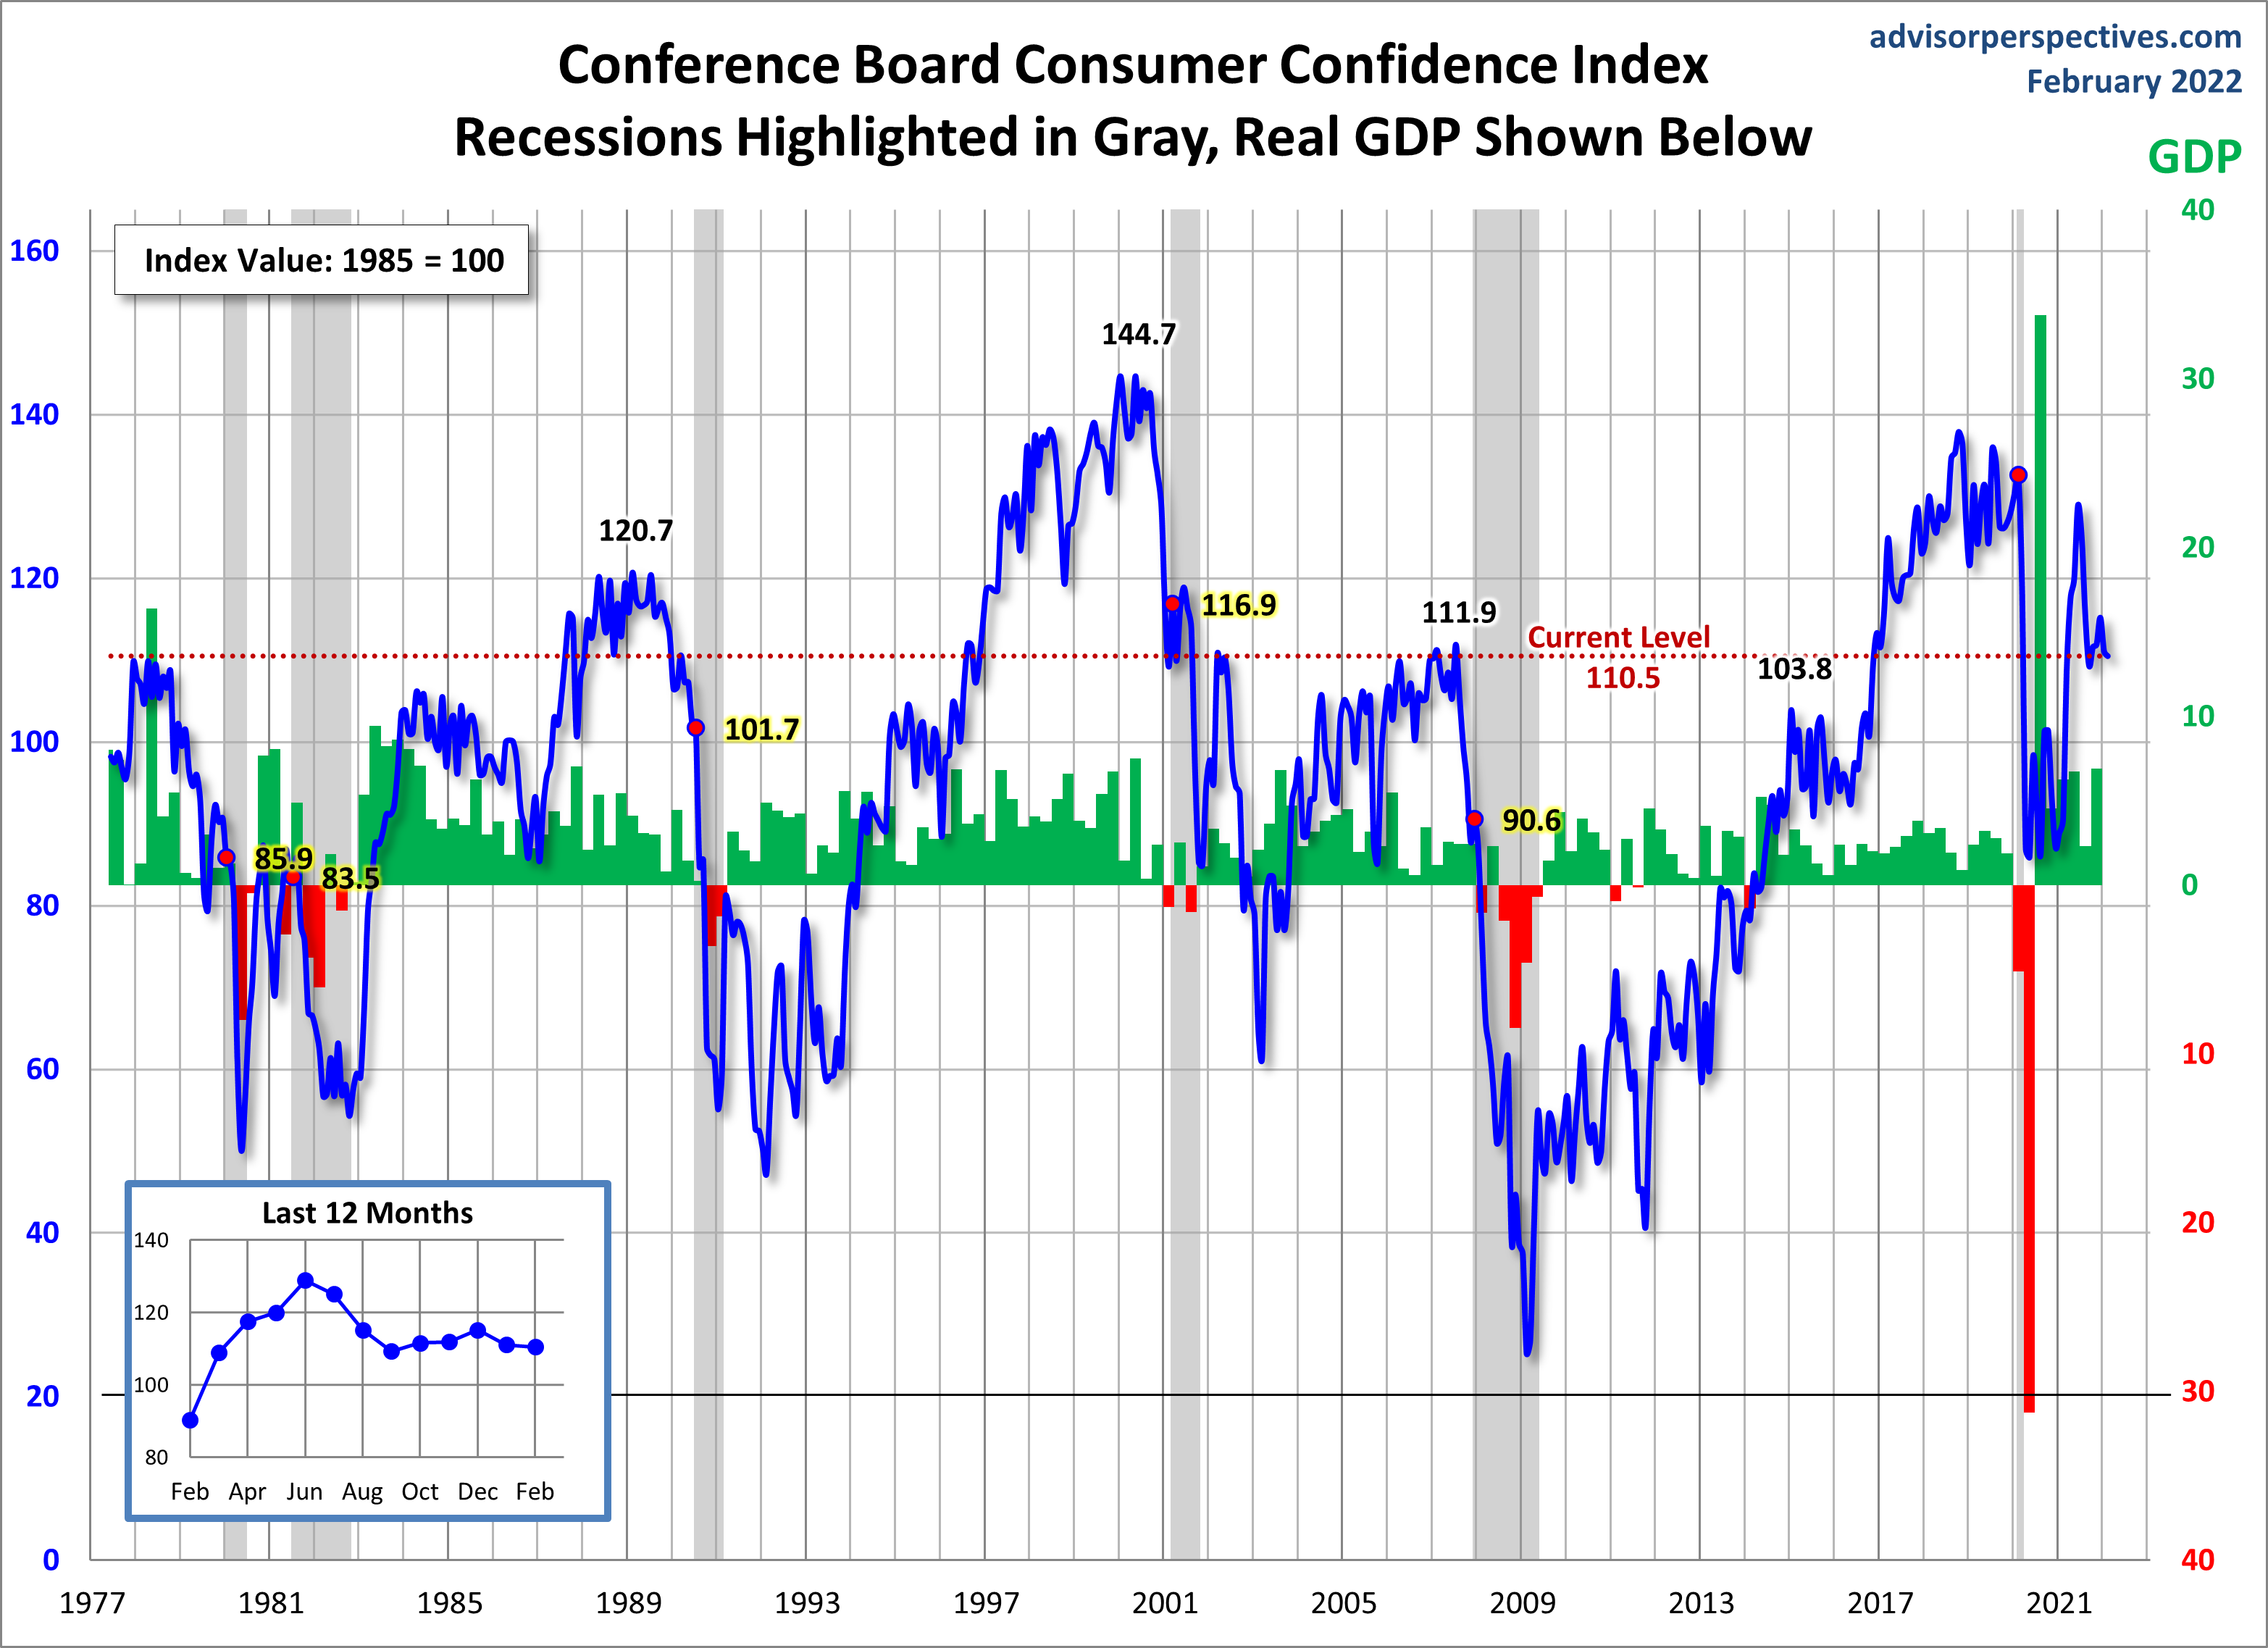
For the sake of comparison, here is a chart of the Conference Board's Consumer Confidence Index (monthly update here). The Conference Board Index is the more volatile of the two, but the broad pattern and general trends have been remarkably similar to the Michigan Index.
(Click on image to enlarge)
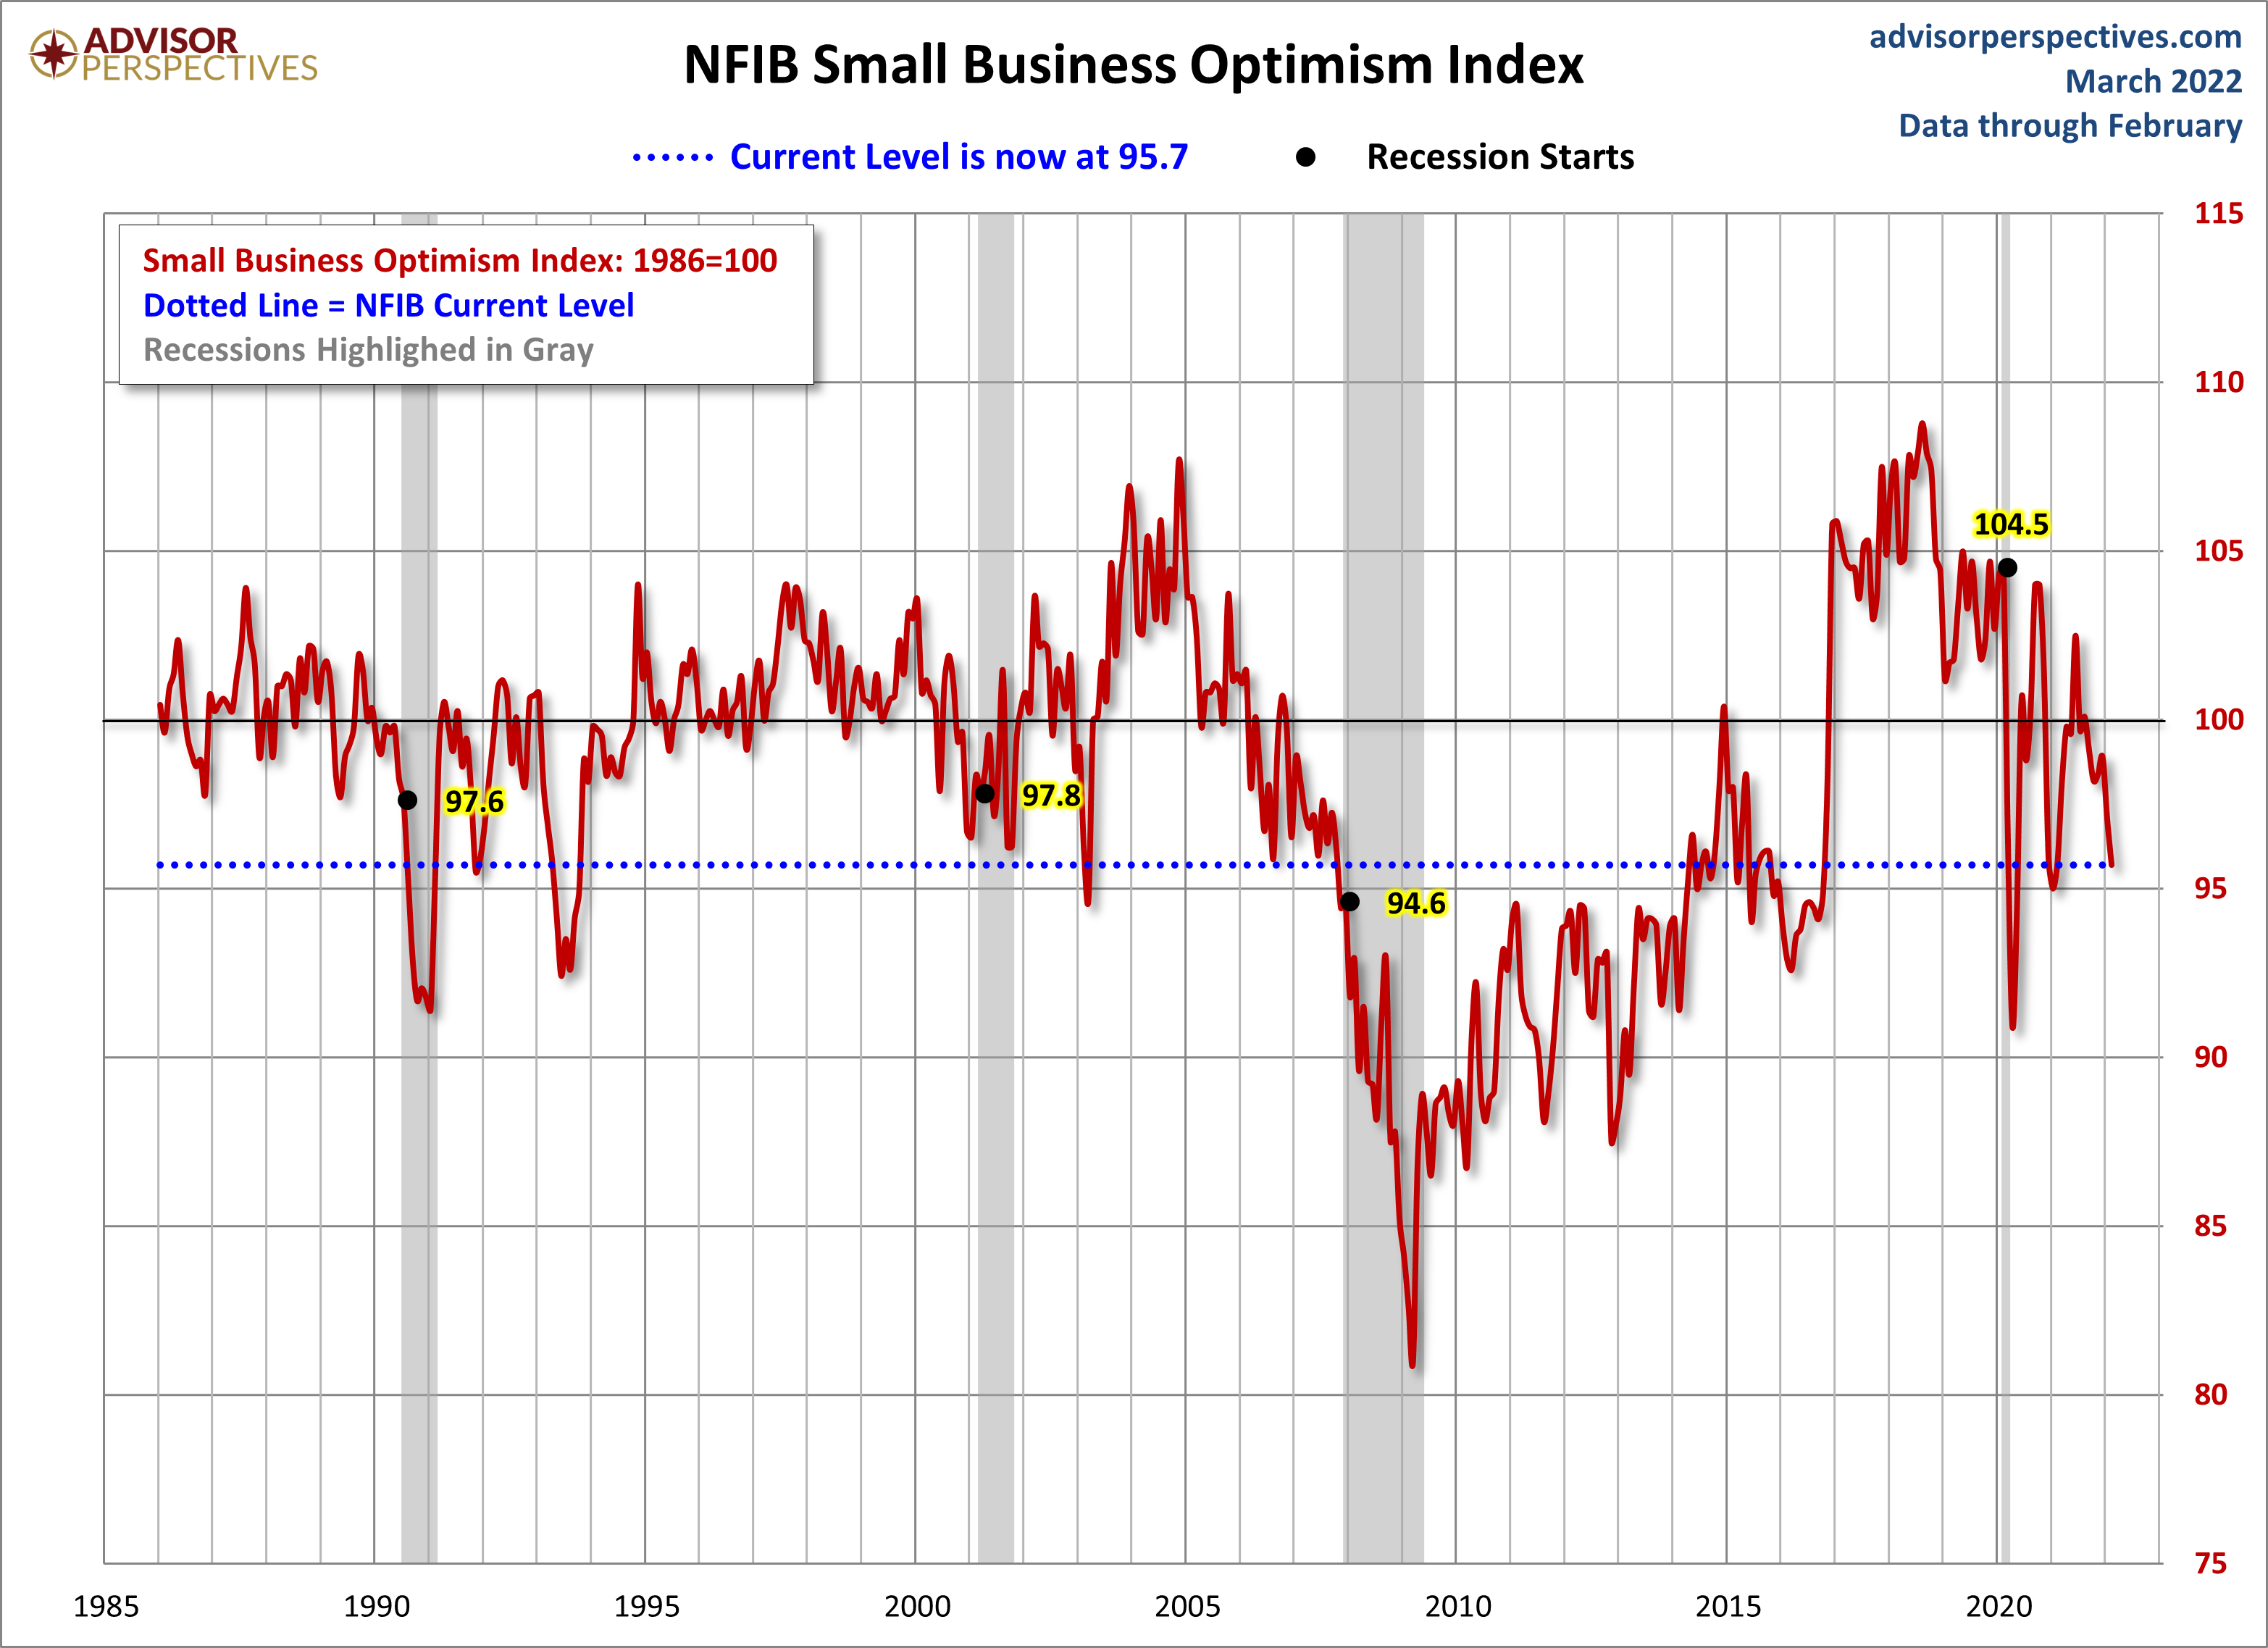
And finally, the prevailing mood of the Michigan survey is also similar to the mood of small business owners, as captured by the NFIB Business Optimism Index.
(Click on image to enlarge)



Comments
Log in or sign up to join the conversation.