
The May Preliminary Report came in at 59.1, down 6.1 (9.4%) from the April Final. Investing.com had forecast 64. Since its beginning in 1978, consumer sentiment is 31.1 percent below the average reading (arithmetic mean) and 30.3 percent below the geometric mean.
Surveys of Consumers chief economist, Richard Curtin, makes the following comments:
Consumer sentiment declined by 9.4% from April, reversing gains realized that month. These declines were broad based--for current economic conditions as well as consumer expectations, and visible across income, age, education, geography, and political affiliation--continuing the general downward trend in sentiment over the past year. Consumers' assessment of their current financial situation relative to a year ago is at its lowest reading since 2013, with 36% of consumers attributing their negative assessment to inflation. Buying conditions for durables reached its lowest reading since the question began appearing on the monthly surveys in 1978, again primarily due to high prices.
The median expected year-ahead inflation rate was 5.4%, little changed over the last three months, and up from 4.6% in May 2021. The mean was considerably higher at 7.4%, reflecting substantial variation in price changes across types of goods and services, and in household spending patterns. At the same time, long term inflation expectations remain well-anchored with a median of 3.0%, settling within the 2.9 to 3.1% range seen over the last 10 months. [More...]
See the chart below for a long-term perspective on this widely watched indicator. Recessions and real GDP are included to help us evaluate the correlation between the Michigan Consumer Sentiment Index and the broader economy.
(Click on image to enlarge)
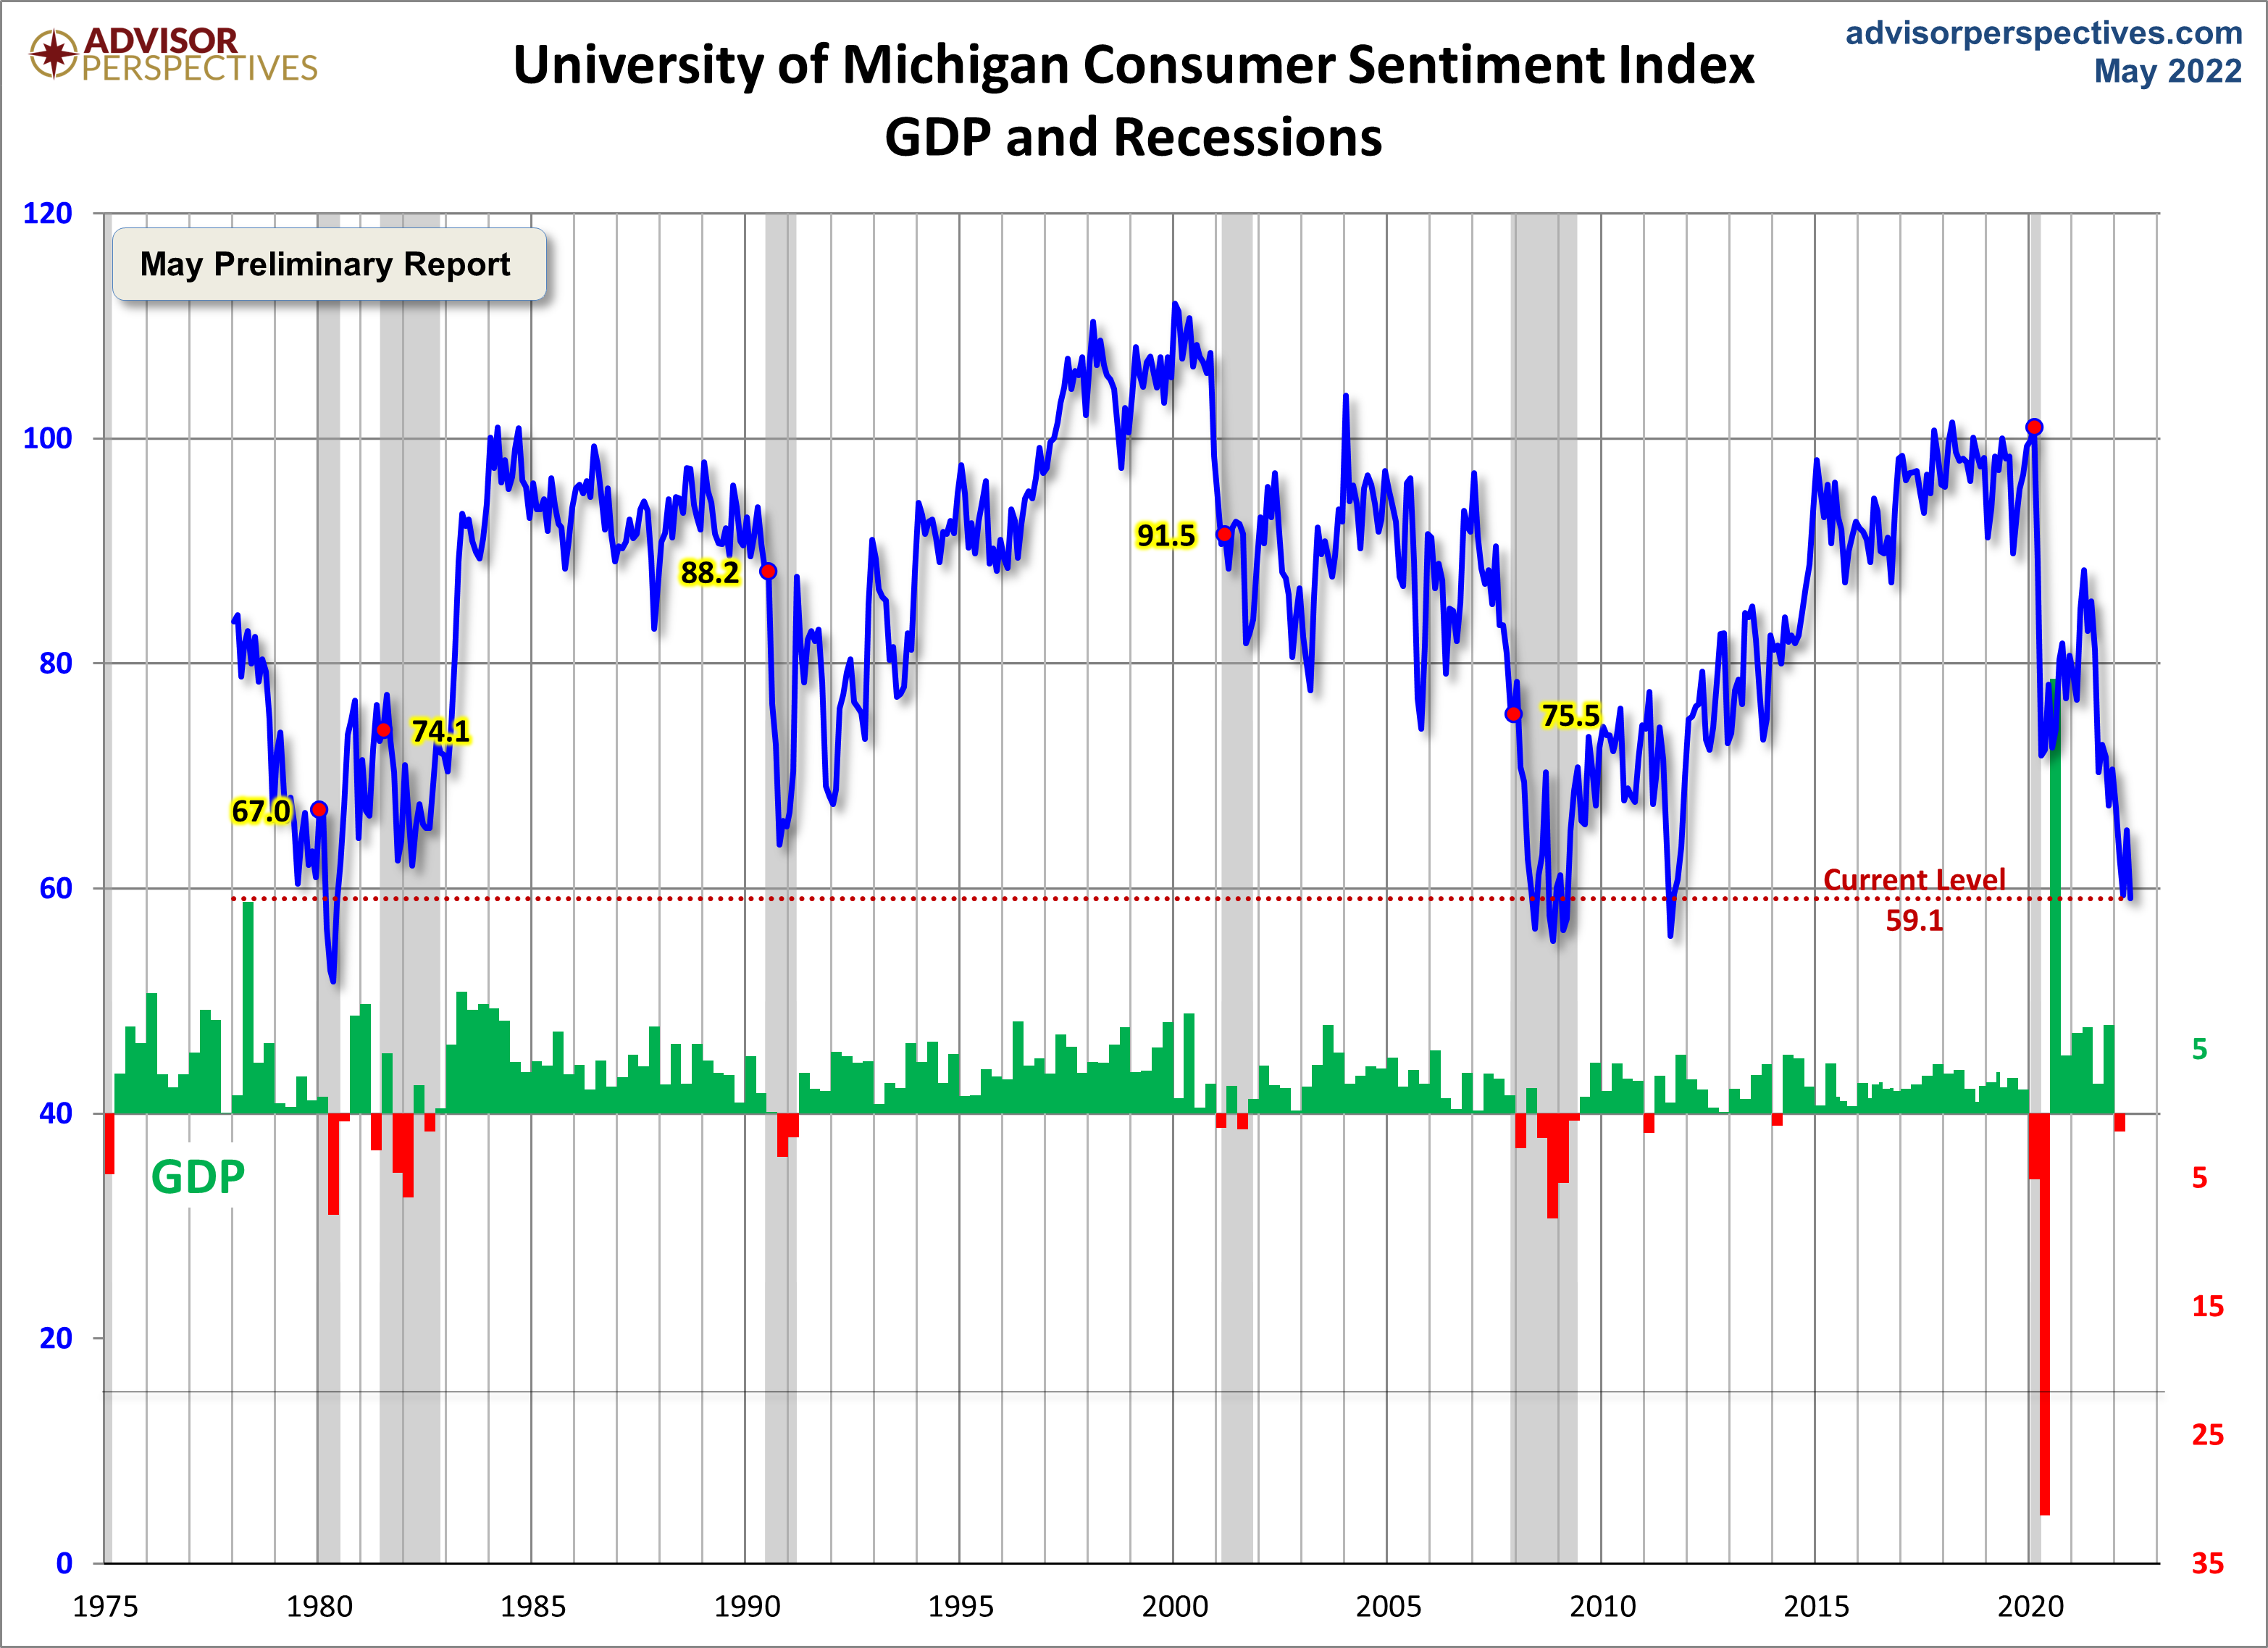
To put today's report into the larger historical context since its beginning in 1978, consumer sentiment is 31.1 percent below the average reading (arithmetic mean) and 30.3 percent below the geometric mean. The current index level is at the 2nd percentile of the 533 monthly data points in this series.
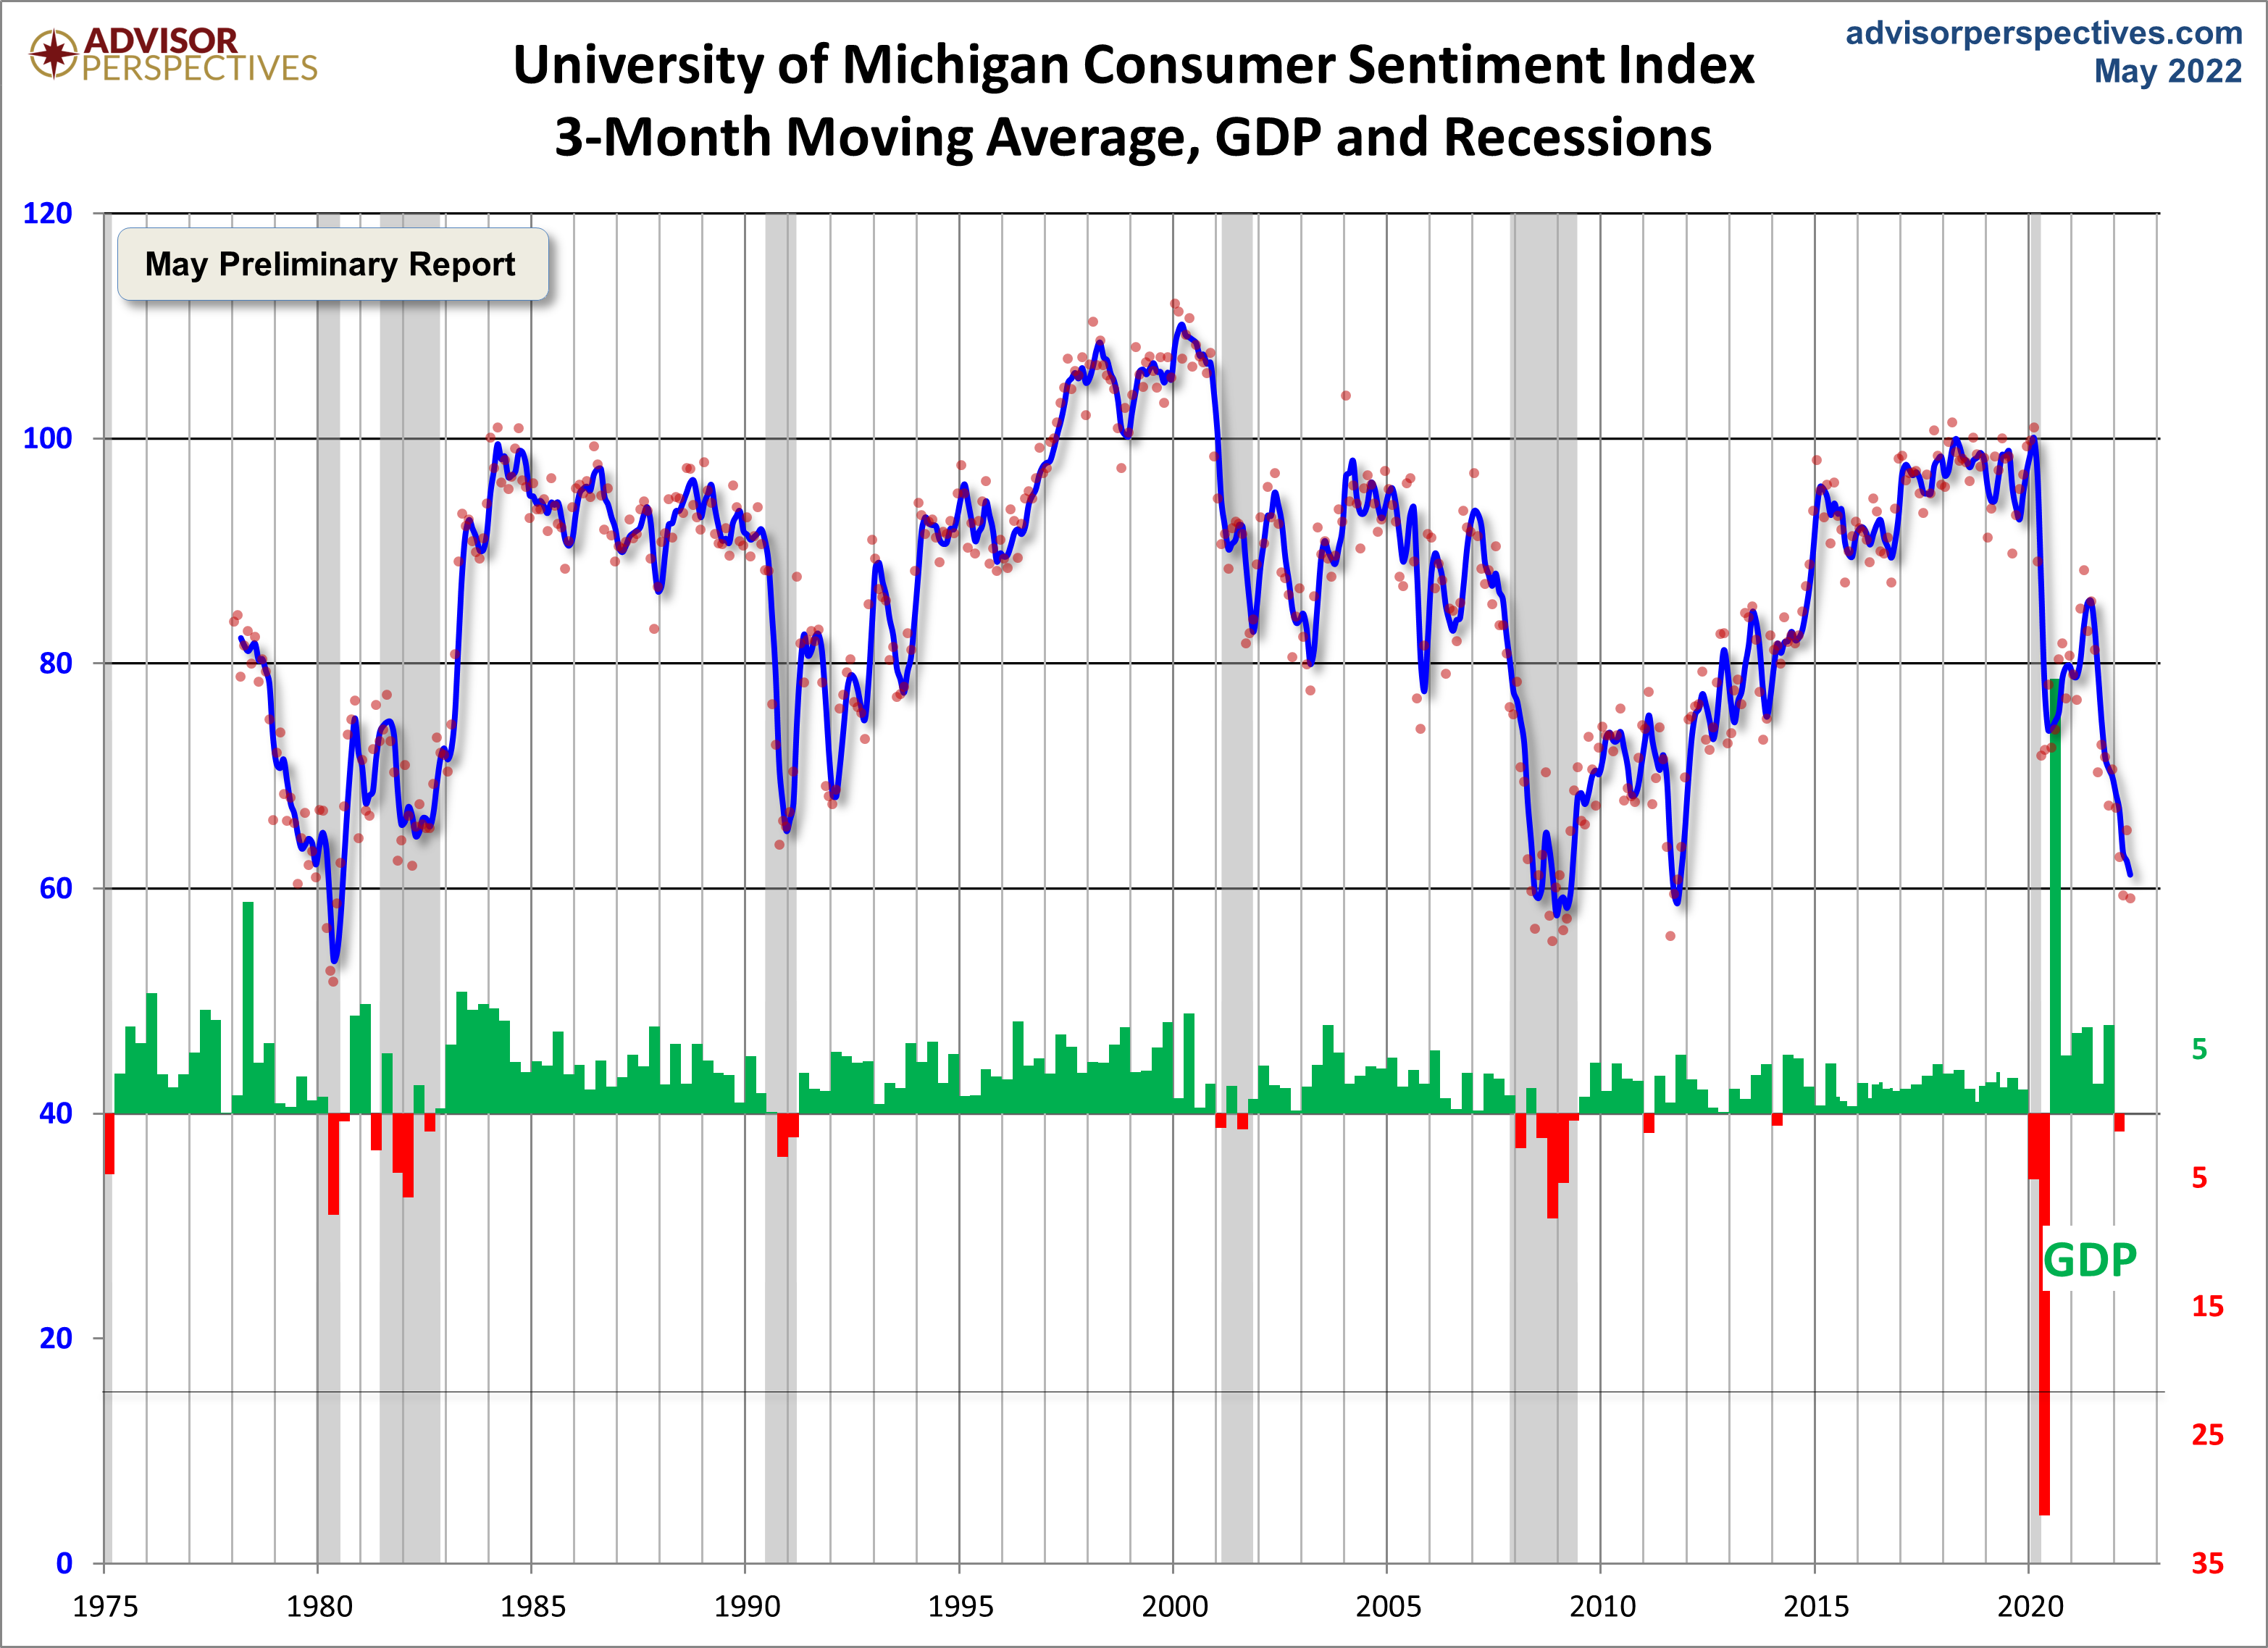
Note that this indicator is somewhat volatile, with a 3.0 point absolute average monthly change. The latest data point saw a 6.1 point decrease from the previous month. For a visual sense of the volatility, here is a chart with the monthly data and a three-month moving average.
(Click on image to enlarge)
For the sake of comparison, here is a chart of the Conference Board's Consumer Confidence Index (monthly update here). The Conference Board Index is the more volatile of the two, but the broad pattern and general trends have been remarkably similar to the Michigan Index.
(Click on image to enlarge)

And finally, the prevailing mood of the Michigan survey is also similar to the mood of small business owners, as captured by the NFIB Business Optimism Index (monthly update here).
(Click on image to enlarge)


Comments
Log in or sign up to join the conversation.