

The January Final came in at 99.8, up 0.5 from the December Final reading.
Surveys of Consumers chief economist, Richard Curtin, makes the following comments:
Consumer sentiment remained at very positive levels, with the January reading of 99.8 insignificantly below the cyclical peak of 101.4. The maintenance of consumer sentiment near cyclical peak levels is surprising given the overall slow pace of economic growth, which was accompanied in January by renewed military engagements in the Mideast, an impeachment trial in the Senate, and a fast spreading coronavirus. The resilience of consumers is remarkable and due to record low unemployment, record gains in income and wealth, as well as near record lows in inflation and interest rates. Gains in personal finances were reported by 53% of all consumers in January, exactly equal to the 2018 and 2019 averages--the highest two years in the past half century. Combined net changes in household income and wealth were cited in 40% of all mentions in January, comparable to the 1966 and 2000 peaks (see the chart). The data currently point toward consumer spending maintaining positive growth in the economy as a whole. Nonetheless, as the presidential primaries begin, consumers will have to evaluate the impact on their own finances from the range of fundamental changes in tax and spending programs advocated by the various candidates. [More...]
See the chart below for a long-term perspective on this widely watched indicator. Recessions and real GDP are included to help us evaluate the correlation between the Michigan Consumer Sentiment Index and the broader economy.
(Click on image to enlarge)
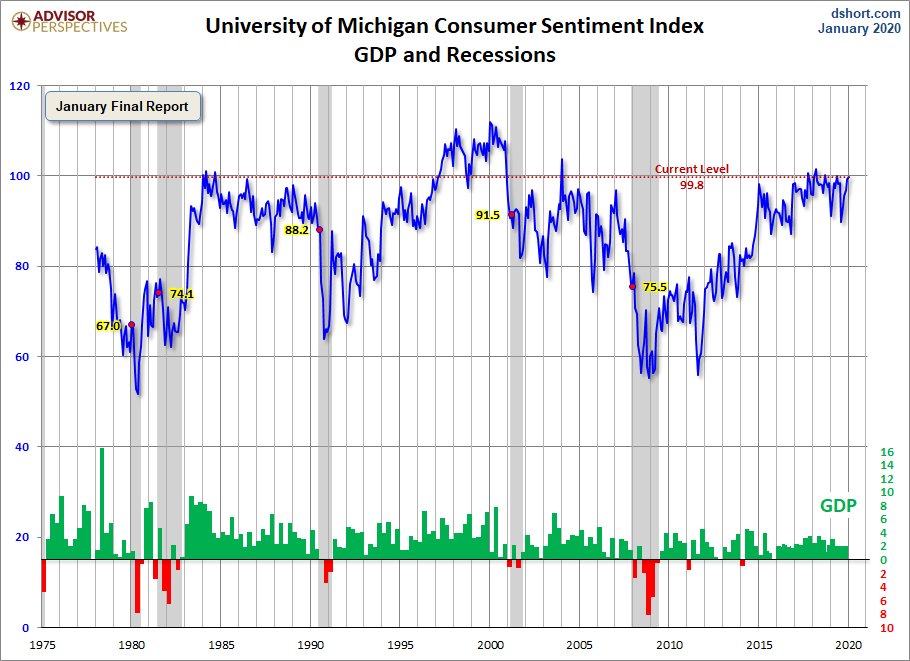
To put today's report into the larger historical context since its beginning in 1978, consumer sentiment is 15.6 percent above the average reading (arithmetic mean) and 16.9 percent above the geometric mean. The current index level is at the 90th percentile of the 505 monthly data points in this series.
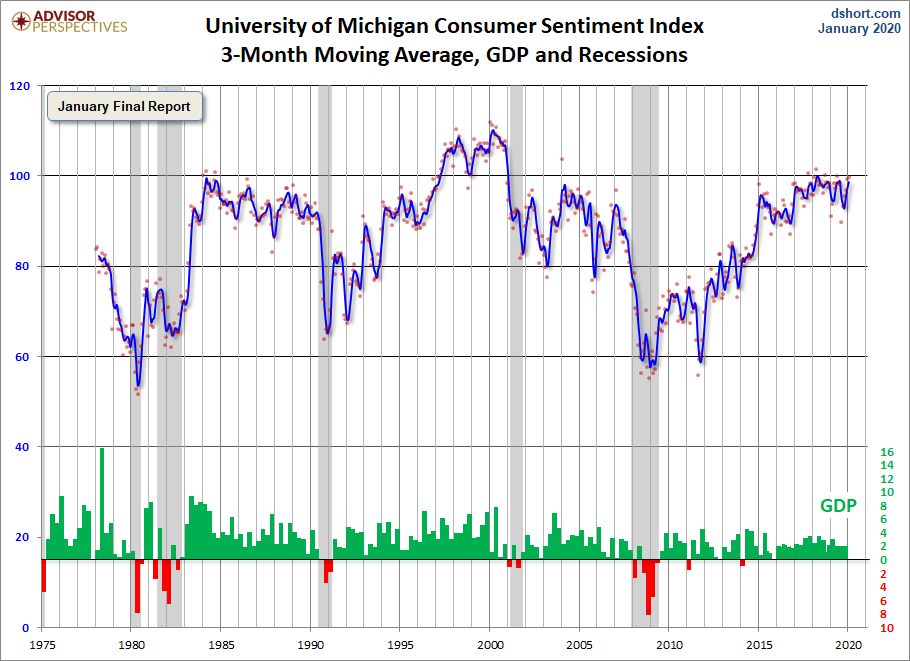
Note that this indicator is somewhat volatile, with a 3.0 point absolute average monthly change. The latest data point saw a 0.5 point increase from the previous month. For a visual sense of the volatility, here is a chart with the monthly data and a three-month moving average.
(Click on image to enlarge)
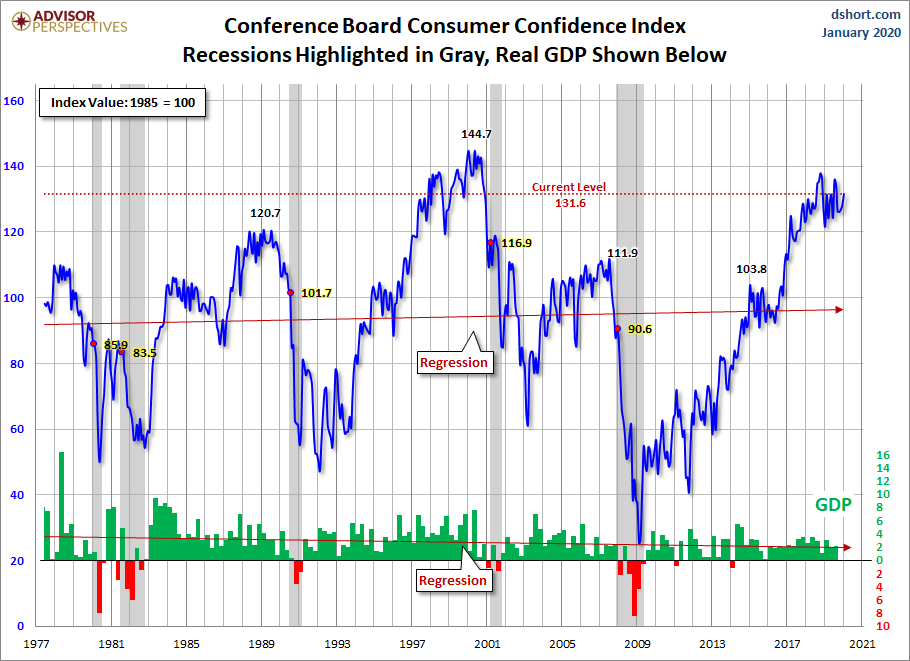
For the sake of comparison, here is a chart of the Conference Board's Consumer Confidence Index (monthly update here). The Conference Board Index is the more volatile of the two, but the broad pattern and general trends have been remarkably similar to the Michigan Index.
(Click on image to enlarge)
And finally, the prevailing mood of the Michigan survey is also similar to the mood of small business owners, as captured by the NFIB Business Optimism Index (monthly update here).
(Click on image to enlarge)
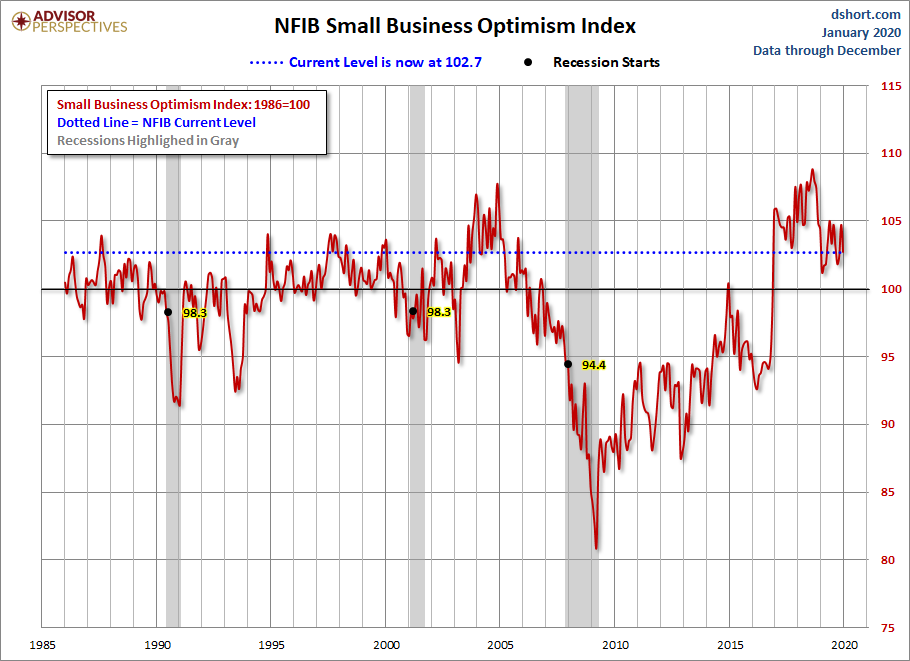
The general trend in the Michigan Sentiment Index since the Financial Crisis lows was one of slow improvement.



Comments
Log in or sign up to join the conversation.