

The December Final Report came in at 70.46, up 3.2 (4.7%) from the November Final. Investing.com had forecast 70.4. Since its beginning in 1978, consumer sentiment is 17.9% below the average reading (arithmetic mean) and 17.0% below the geometric mean.
Surveys of Consumers chief economist, Richard Curtin, makes the following comments:
"The Sentiment Index improved in December. The uptick was primarily due to significant gains among households with incomes in the bottom third of the distribution. Indeed, the bottom third expected their incomes to rise during the year ahead by 2.8%, up from 1.8% last December, and the highest level since 2.9% was recorded in 1999. There have only been five times in the past half century that income expectations among low income households have exceeded the December 2021 level.
"The announced increase in Social Security payments of 5.9% in 2022 was partly responsible for the gain, and 5.0% increases in expected wage among the youngest workers. Importantly, too few interviews were conducted to capture the impact of the rapid spread of the Omicron variant in the U.S. Confidence and spending are likely to be depressed in January, but it is too early to know the eventual impact of Omicron on the economy.
Consumers' evaluations of their current finances remained unchanged at lower levels due to the erosion of their living standards from rising inflation. One-in-four households specifically cited the negative impact of inflation on their living standards. The partisan nature of consumer expectations has overwhelmed other economic correlates. Democrats anticipate much lower inflation rates than Republicans for the year ahead (3.0% vs. 6.8%) and over the longer term (2.3% vs. 4.4%).
"Moreover, three times as many Republicans as Democrats cited the negative impact on their finances from inflation (47% vs. 16%). Sharp differences in expected gains in nominal incomes were also found by partisanship, as Democrats anticipated much higher gains than Republicans (2.7% vs. 0.4%). Independents, who are least likely to be influenced by partisanship, equaled the median expected income response across partisan subgroups. This finding has been widely replicated across many other expectations, and indicates that partisan extremes generally offset and the sum is approximately equal the views of Independents. [More...]"
See the chart below for a long-term perspective on this widely watched indicator. Recessions and real GDP are included to help us evaluate the correlation between the Michigan Consumer Sentiment Index and the broader economy.
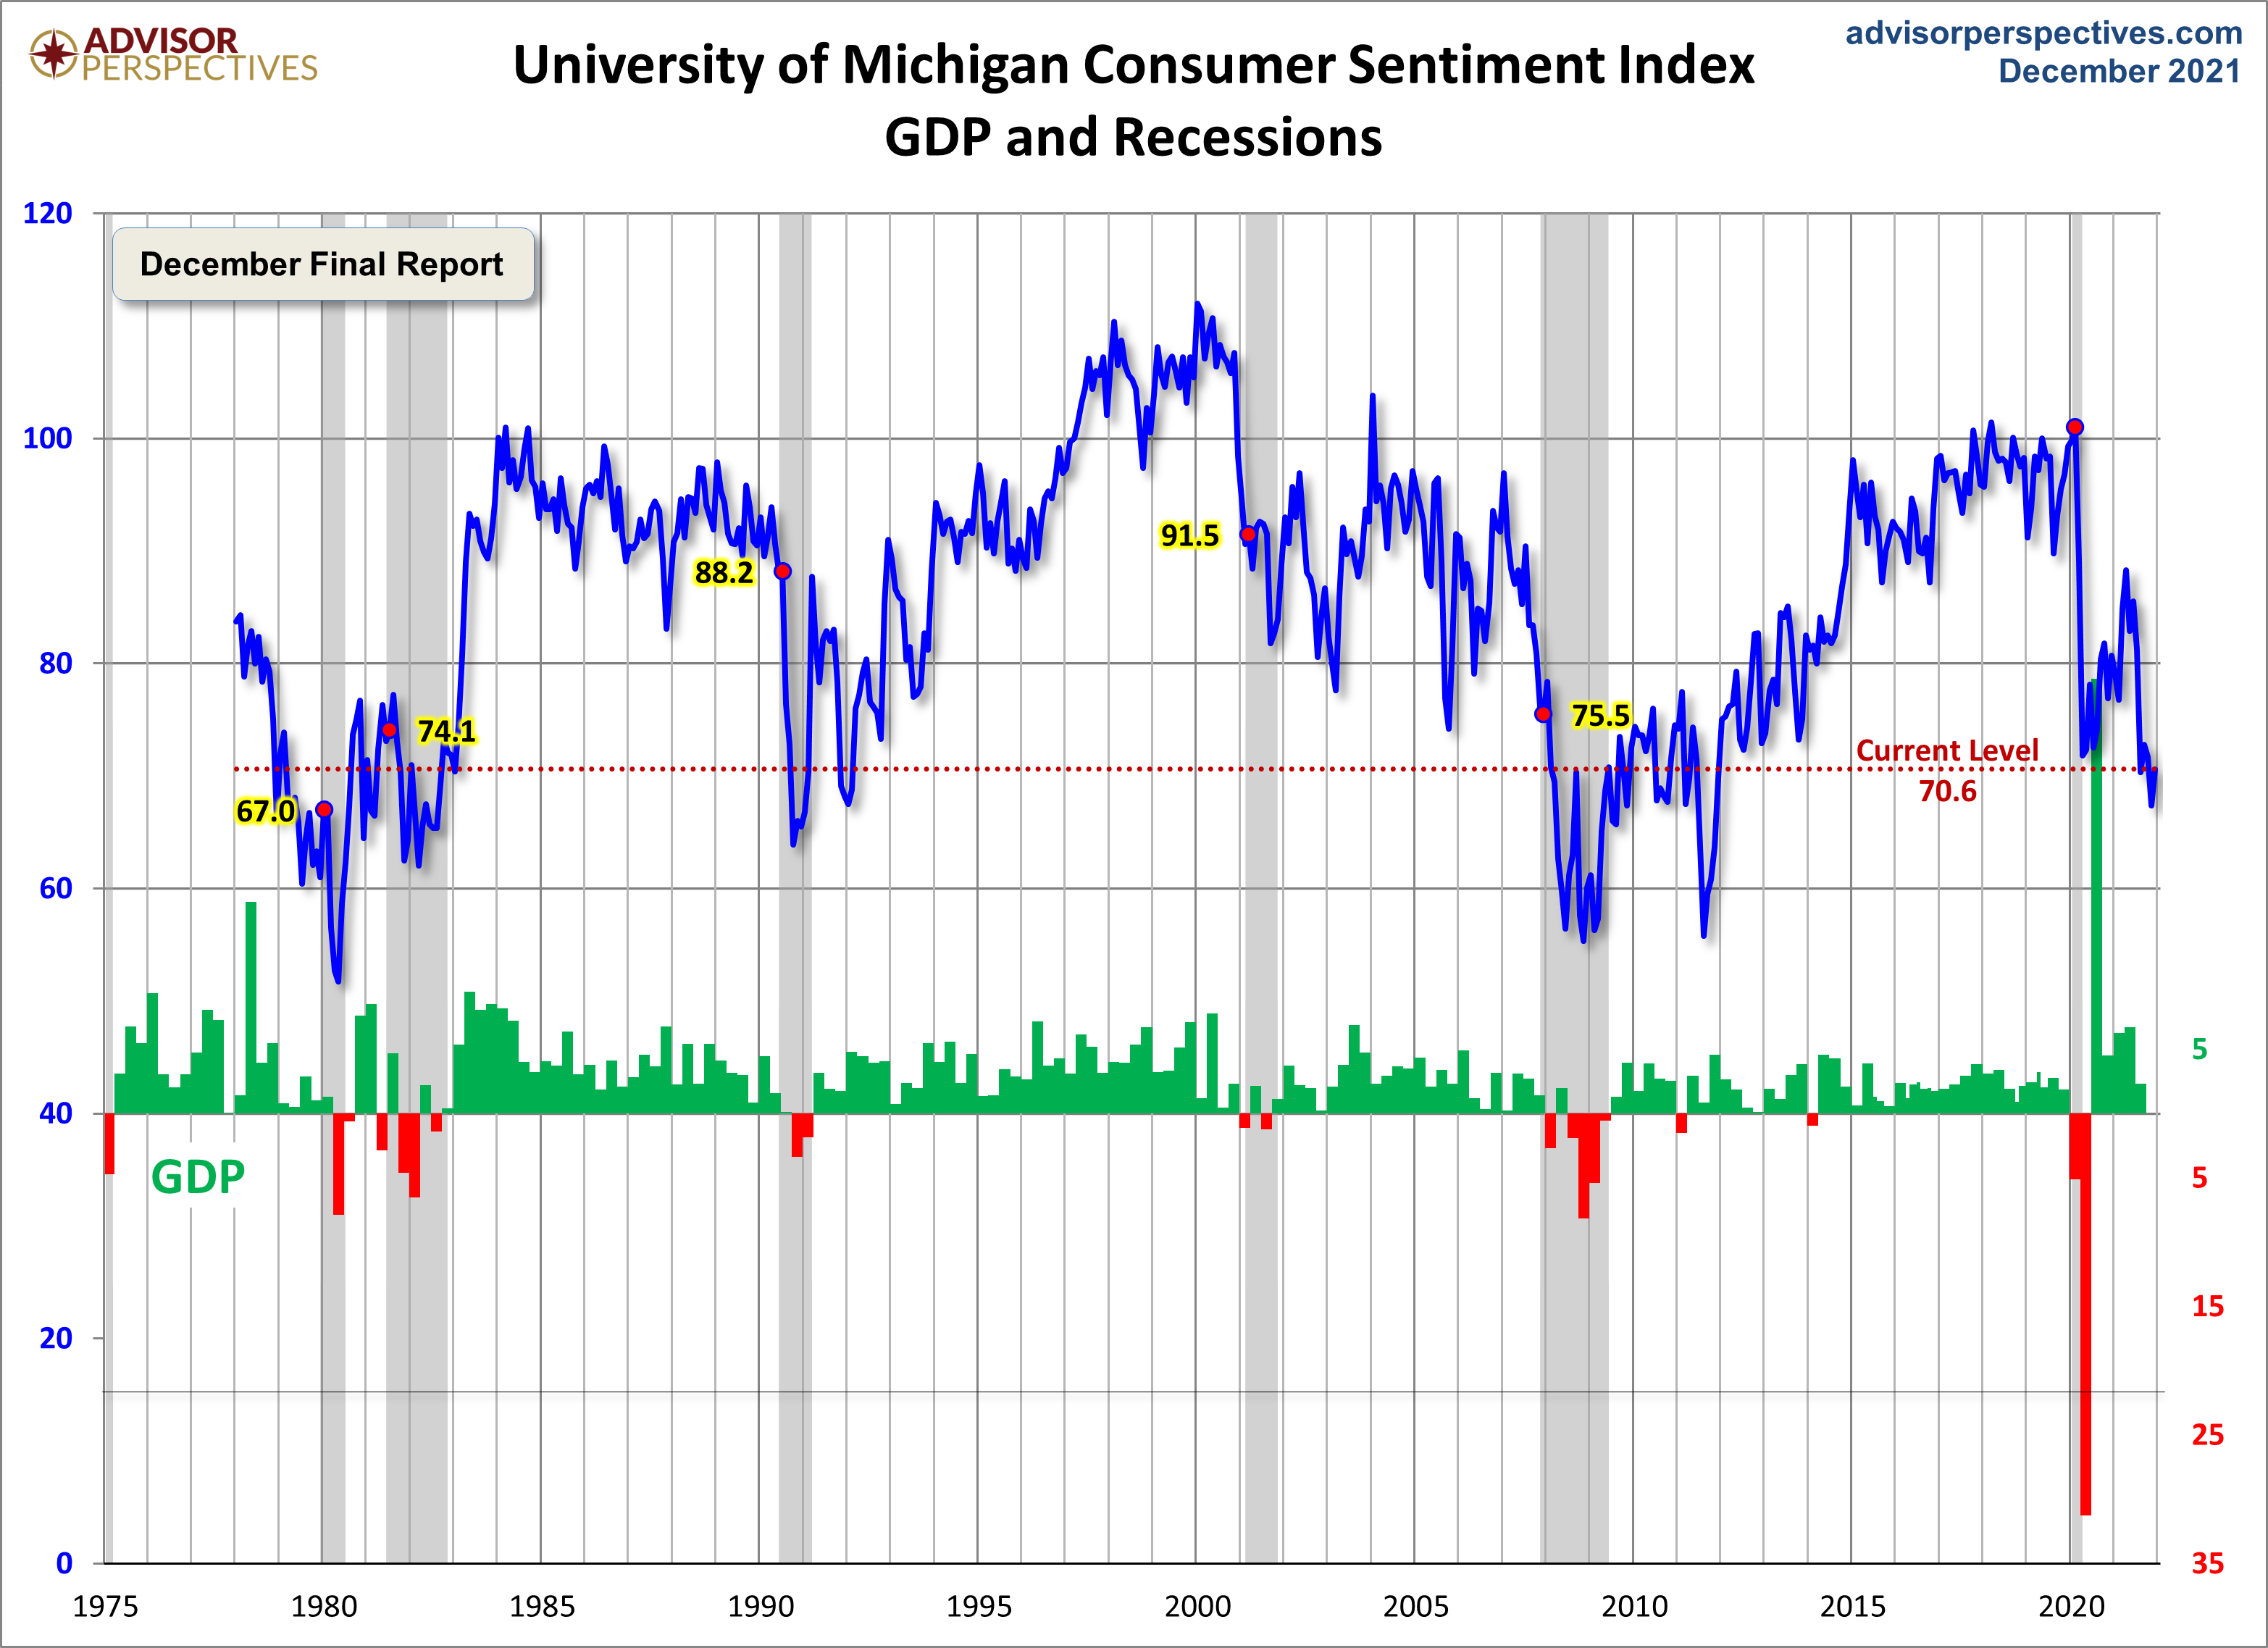
To put today's report into the larger historical context since its beginning in 1978, consumer sentiment is 17.9% below the average reading (arithmetic mean) and 17.0% above the geometric mean. The current index level is at the 14th percentile of the 528 monthly data points in this series.
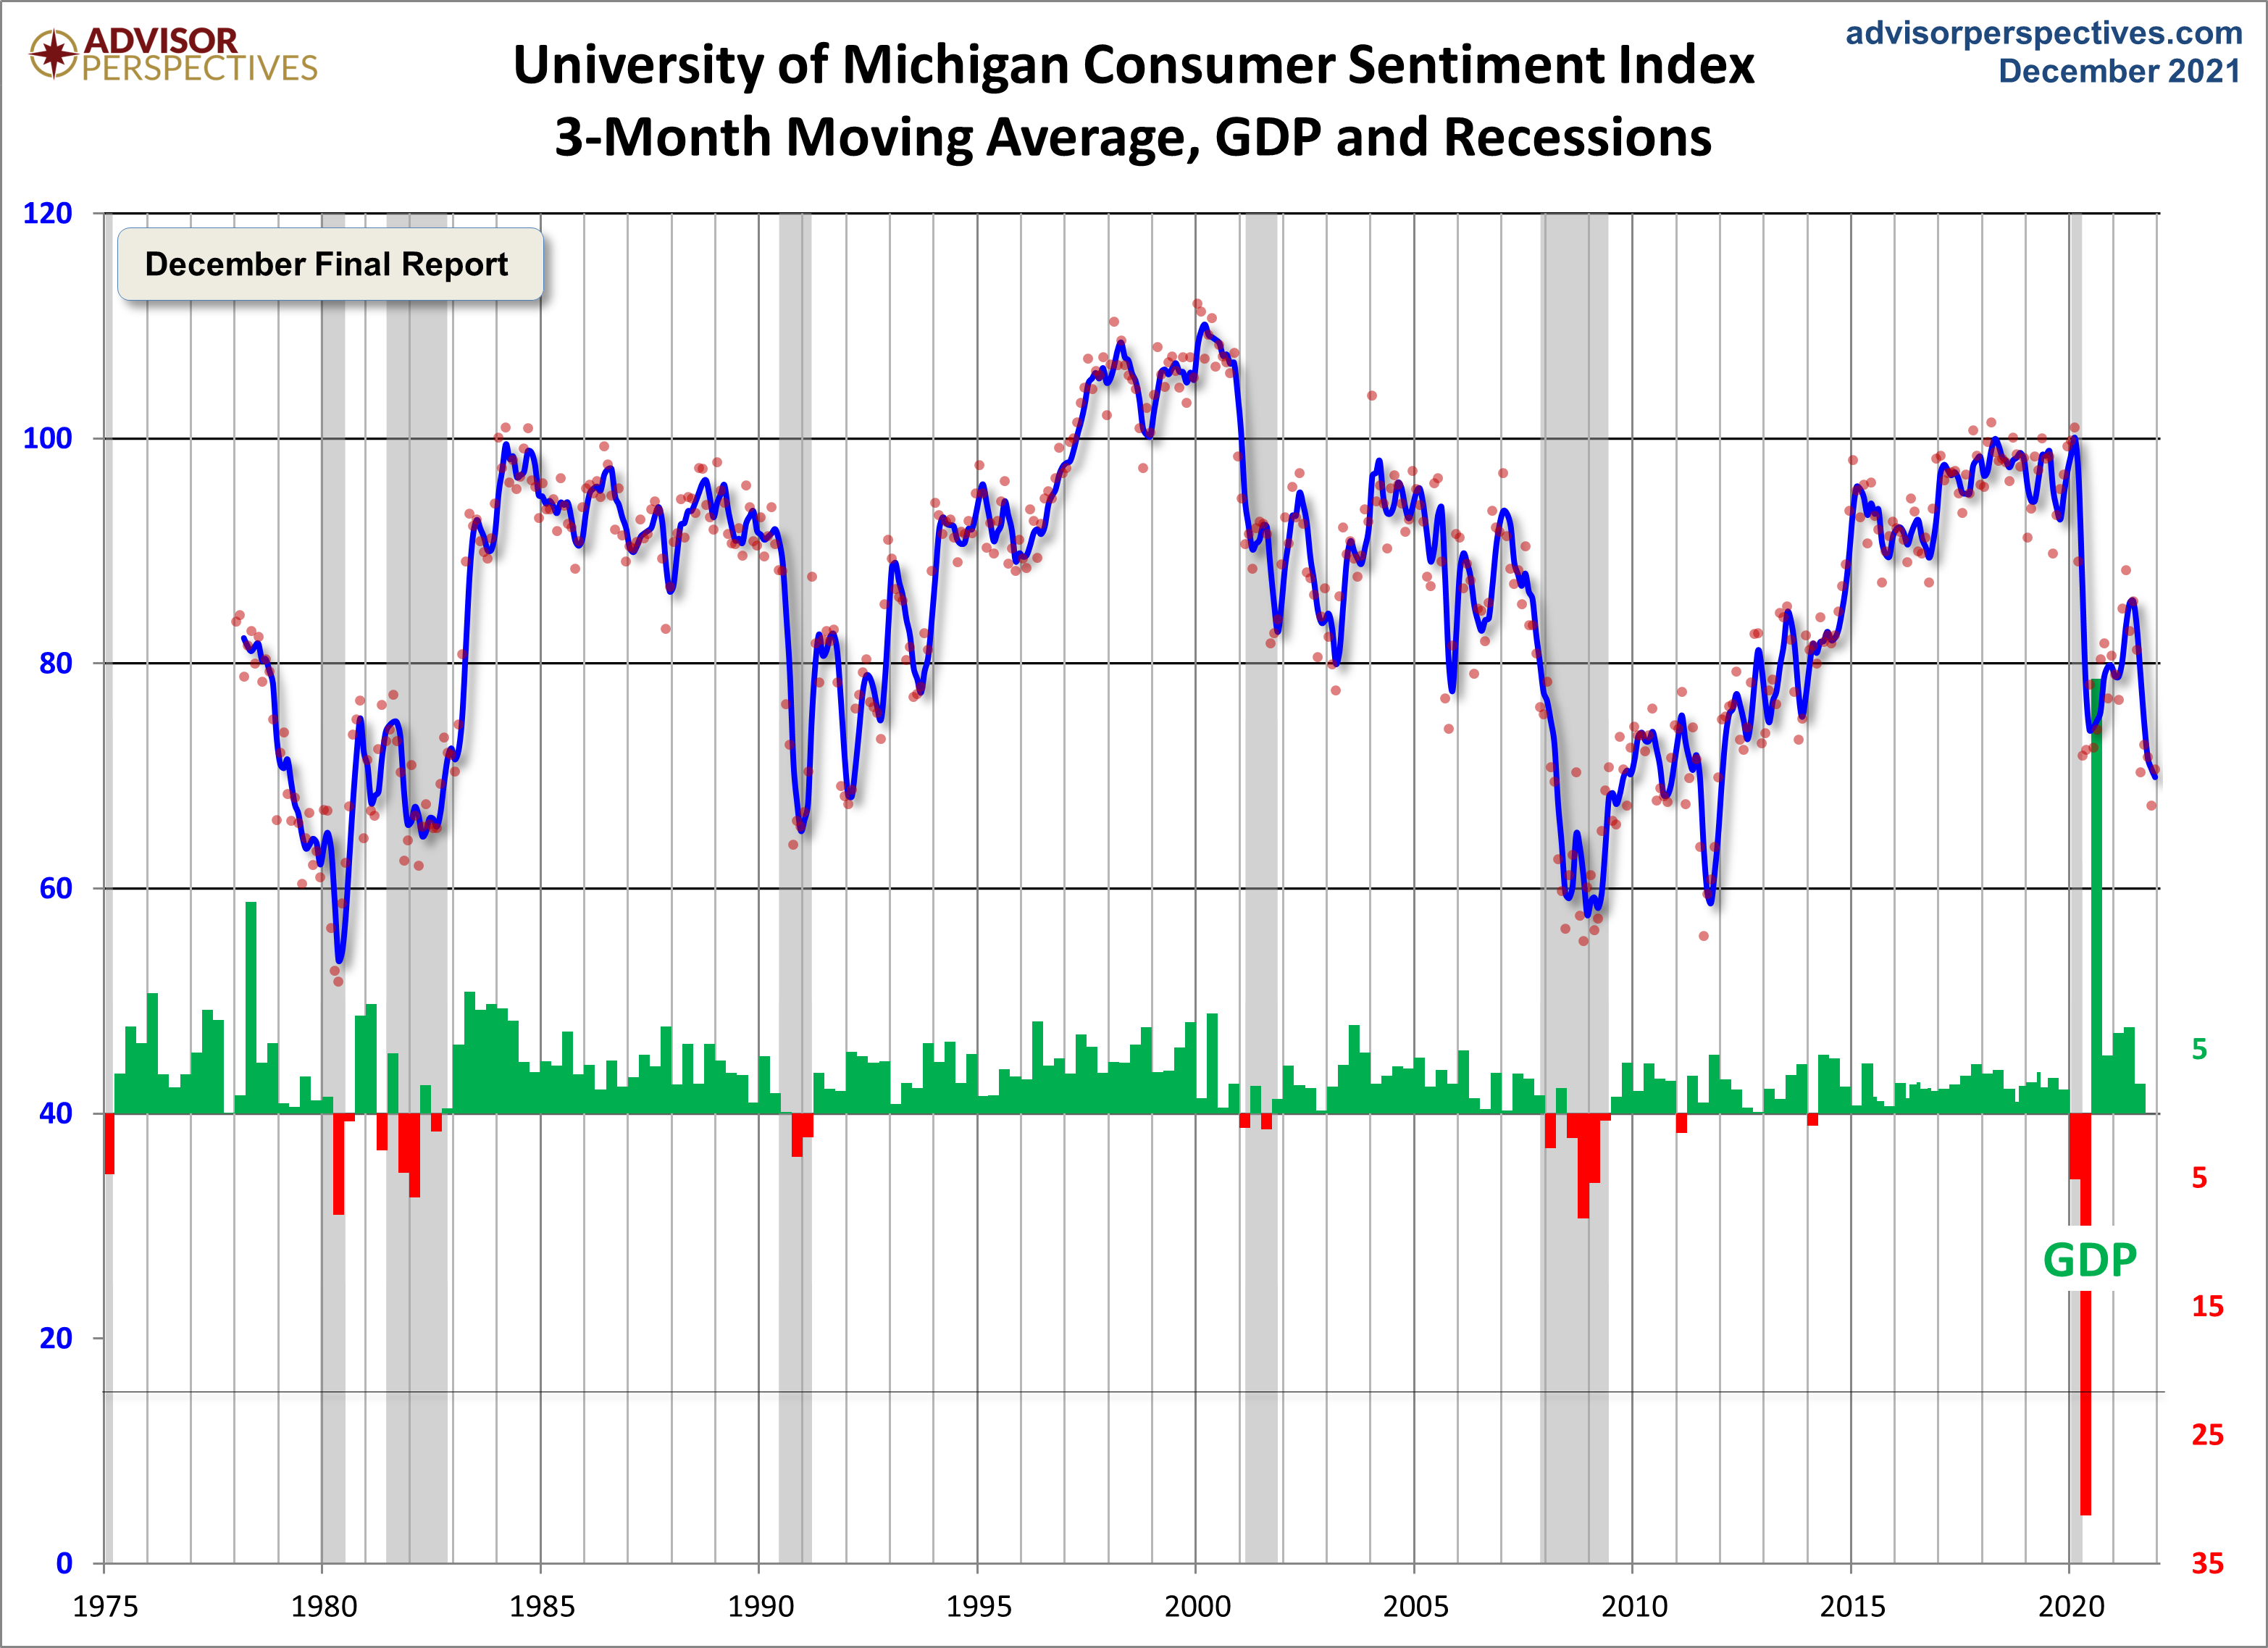
Note that this indicator is somewhat volatile, with a 3.0 point absolute average monthly change. The latest data point saw a 3.2 point increase from the previous month. For a visual sense of the volatility, here is a chart with the monthly data and a three-month moving average.
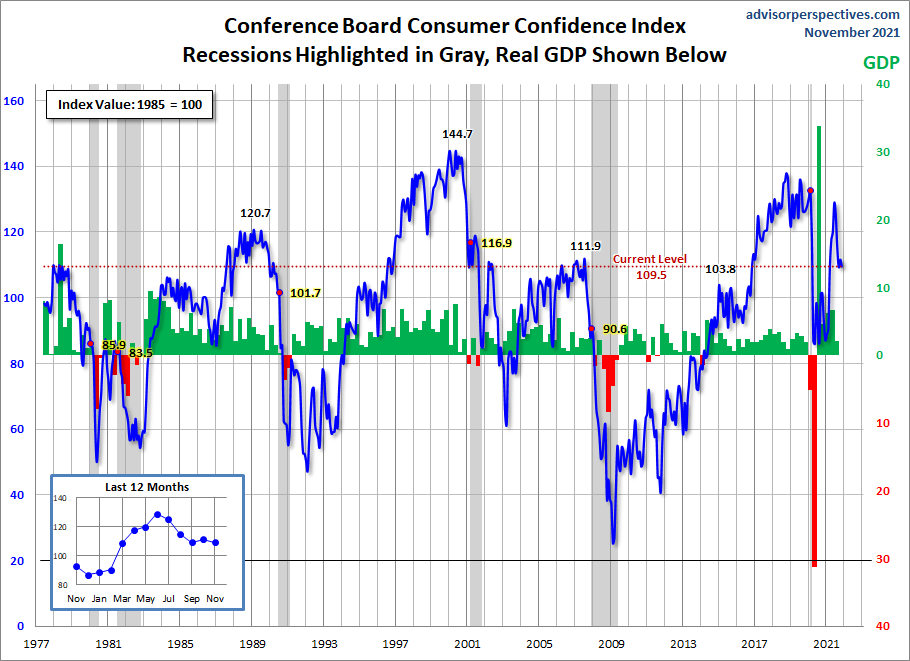
For the sake of comparison, here is a chart of the Conference Board's Consumer Confidence Index (monthly update here). The Conference Board Index is the more volatile of the two, but the broad pattern and general trends have been remarkably similar to the Michigan Index.
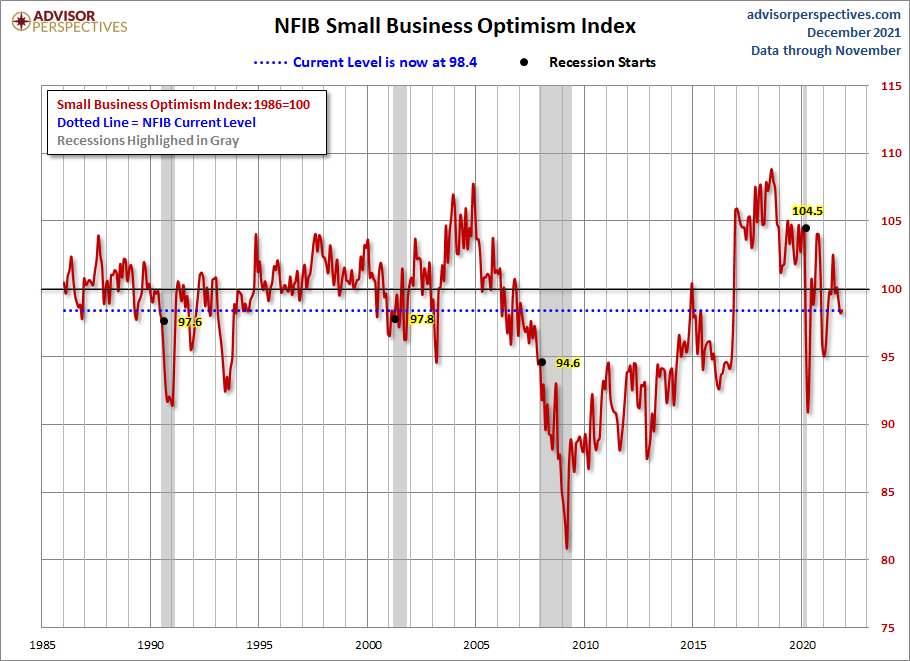
And finally, the prevailing mood of the Michigan survey is also similar to the mood of small business owners, as captured by the NFIB Business Optimism Index (monthly update here).
The next update to this report will be published on Jan. 14.



Comments
Log in or sign up to join the conversation.