
The February Preliminary Report came in at 61.7, down 5.5 (8.2%) from the January Final. Investing.com had a forecast 67.5. Since its beginning in 1978, consumer sentiment is 28.2 percent below the average reading (arithmetic mean) and 27.4 percent below the geometric mean.
Surveys of Consumers chief economist, Richard Curtin, makes the following comments:
Sentiment continued its downward descent, reaching its worst level in a decade, falling a stunning 8.2% from last month and 19.7% from last February. The recent declines have been driven by weakening personal financial prospects, largely due to rising inflation, less confidence in the government's economic policies, and the least favorable long term economic outlook in a decade. Importantly, the entire February decline was among households with incomes of $100,000 or more; their Sentiment Index fell by 16.1% from last month, and 27.5% from last year. The impact of higher inflation on personal finances was spontaneously cited by one-third of all consumers, with nearly half of all consumers expecting declines in their inflation adjusted incomes during the year ahead. In addition, fewer households cited rising net household wealth since the pandemic low in May 2020, largely due to the falling likelihood of stock price increases in 2022.
The recent declines have meant that the Sentiment Index now signals the onset of a sustained downturn in consumer spending (see the chart). The depth of the slump, however, is subject to several caveats that have not been present in prior downturns: the impact of unspent stimulus funds, the partisan distortion of expectations, and the pandemic's disruption of spending and work patterns. Households have amassed substantial savings and reserve funds from the stimmies as well as due to more limited consumption choices, especially services. There may be a lessened need for additional precautionary savings and a greater desire to engage in discretionary spending. [More...]
See the chart below for a long-term perspective on this widely watched indicator. Recessions and real GDP are included to help us evaluate the correlation between the Michigan Consumer Sentiment Index and the broader economy.
(Click on image to enlarge)
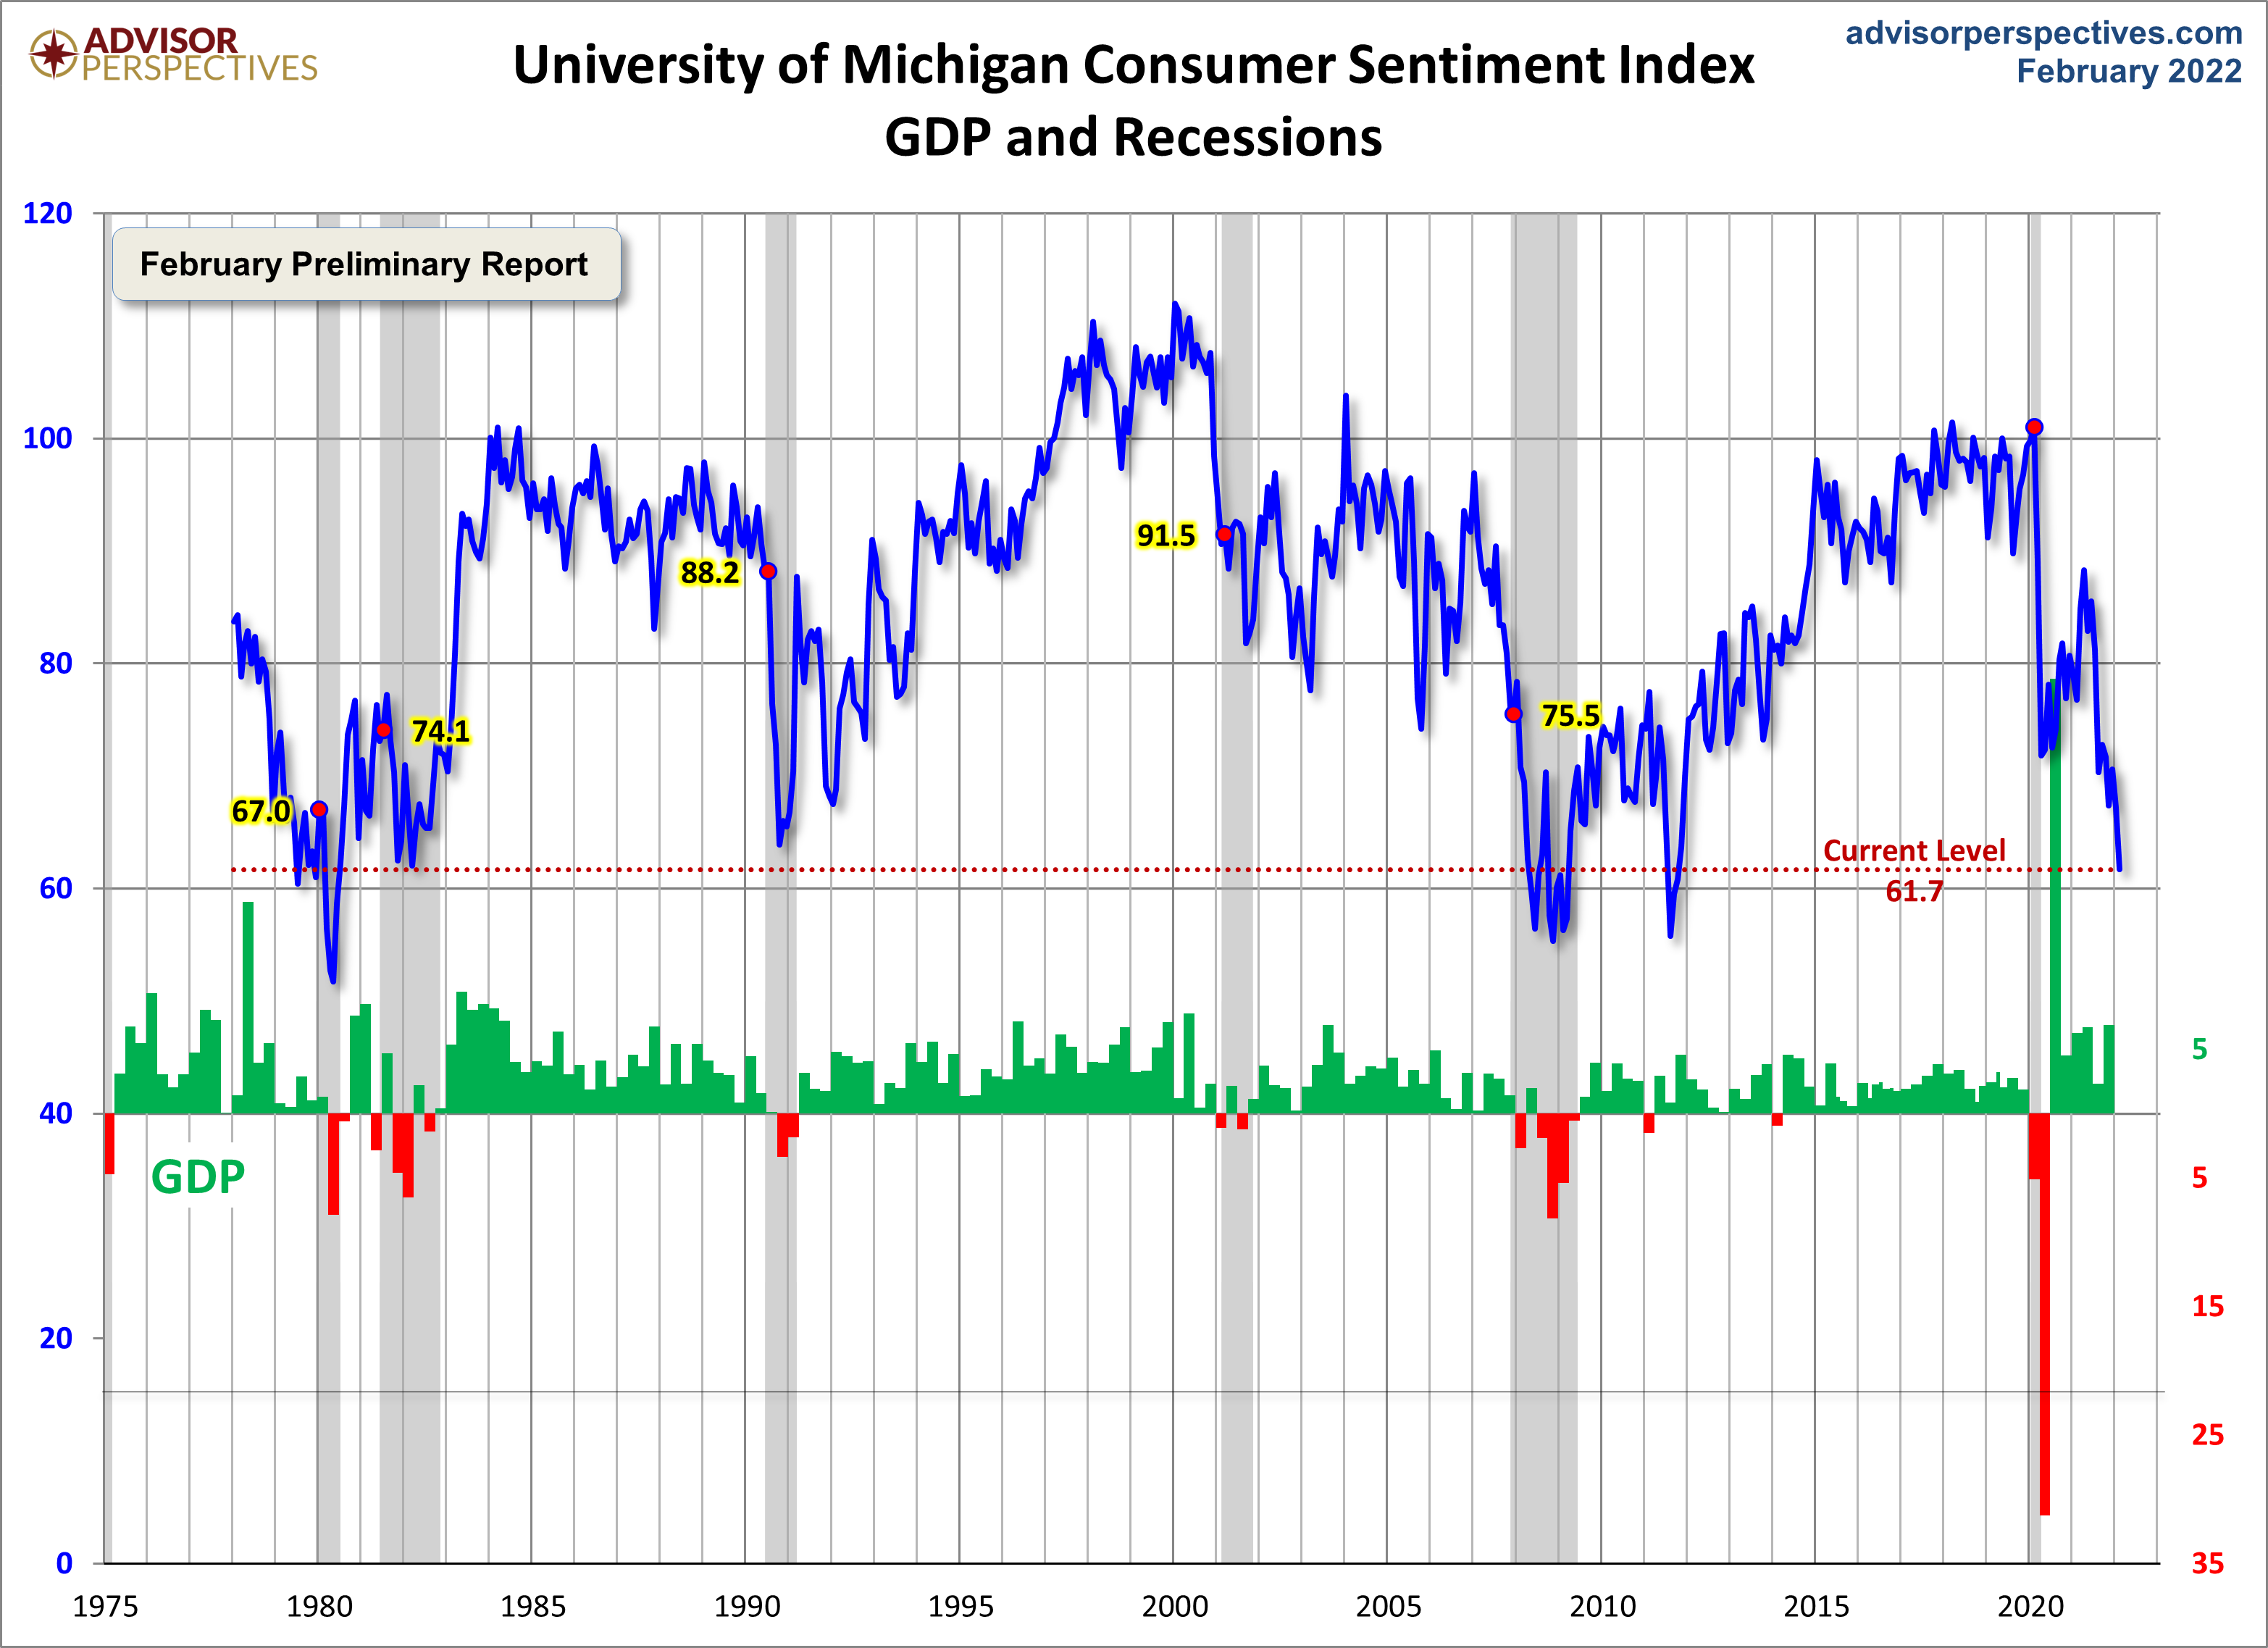
To put today's report into the larger historical context since its beginning in 1978, consumer sentiment is 28.2 percent below the average reading (arithmetic mean) and 27.4 percent below the geometric mean. The current index level is at the 3rd percentile of the 530 monthly data points in this series.
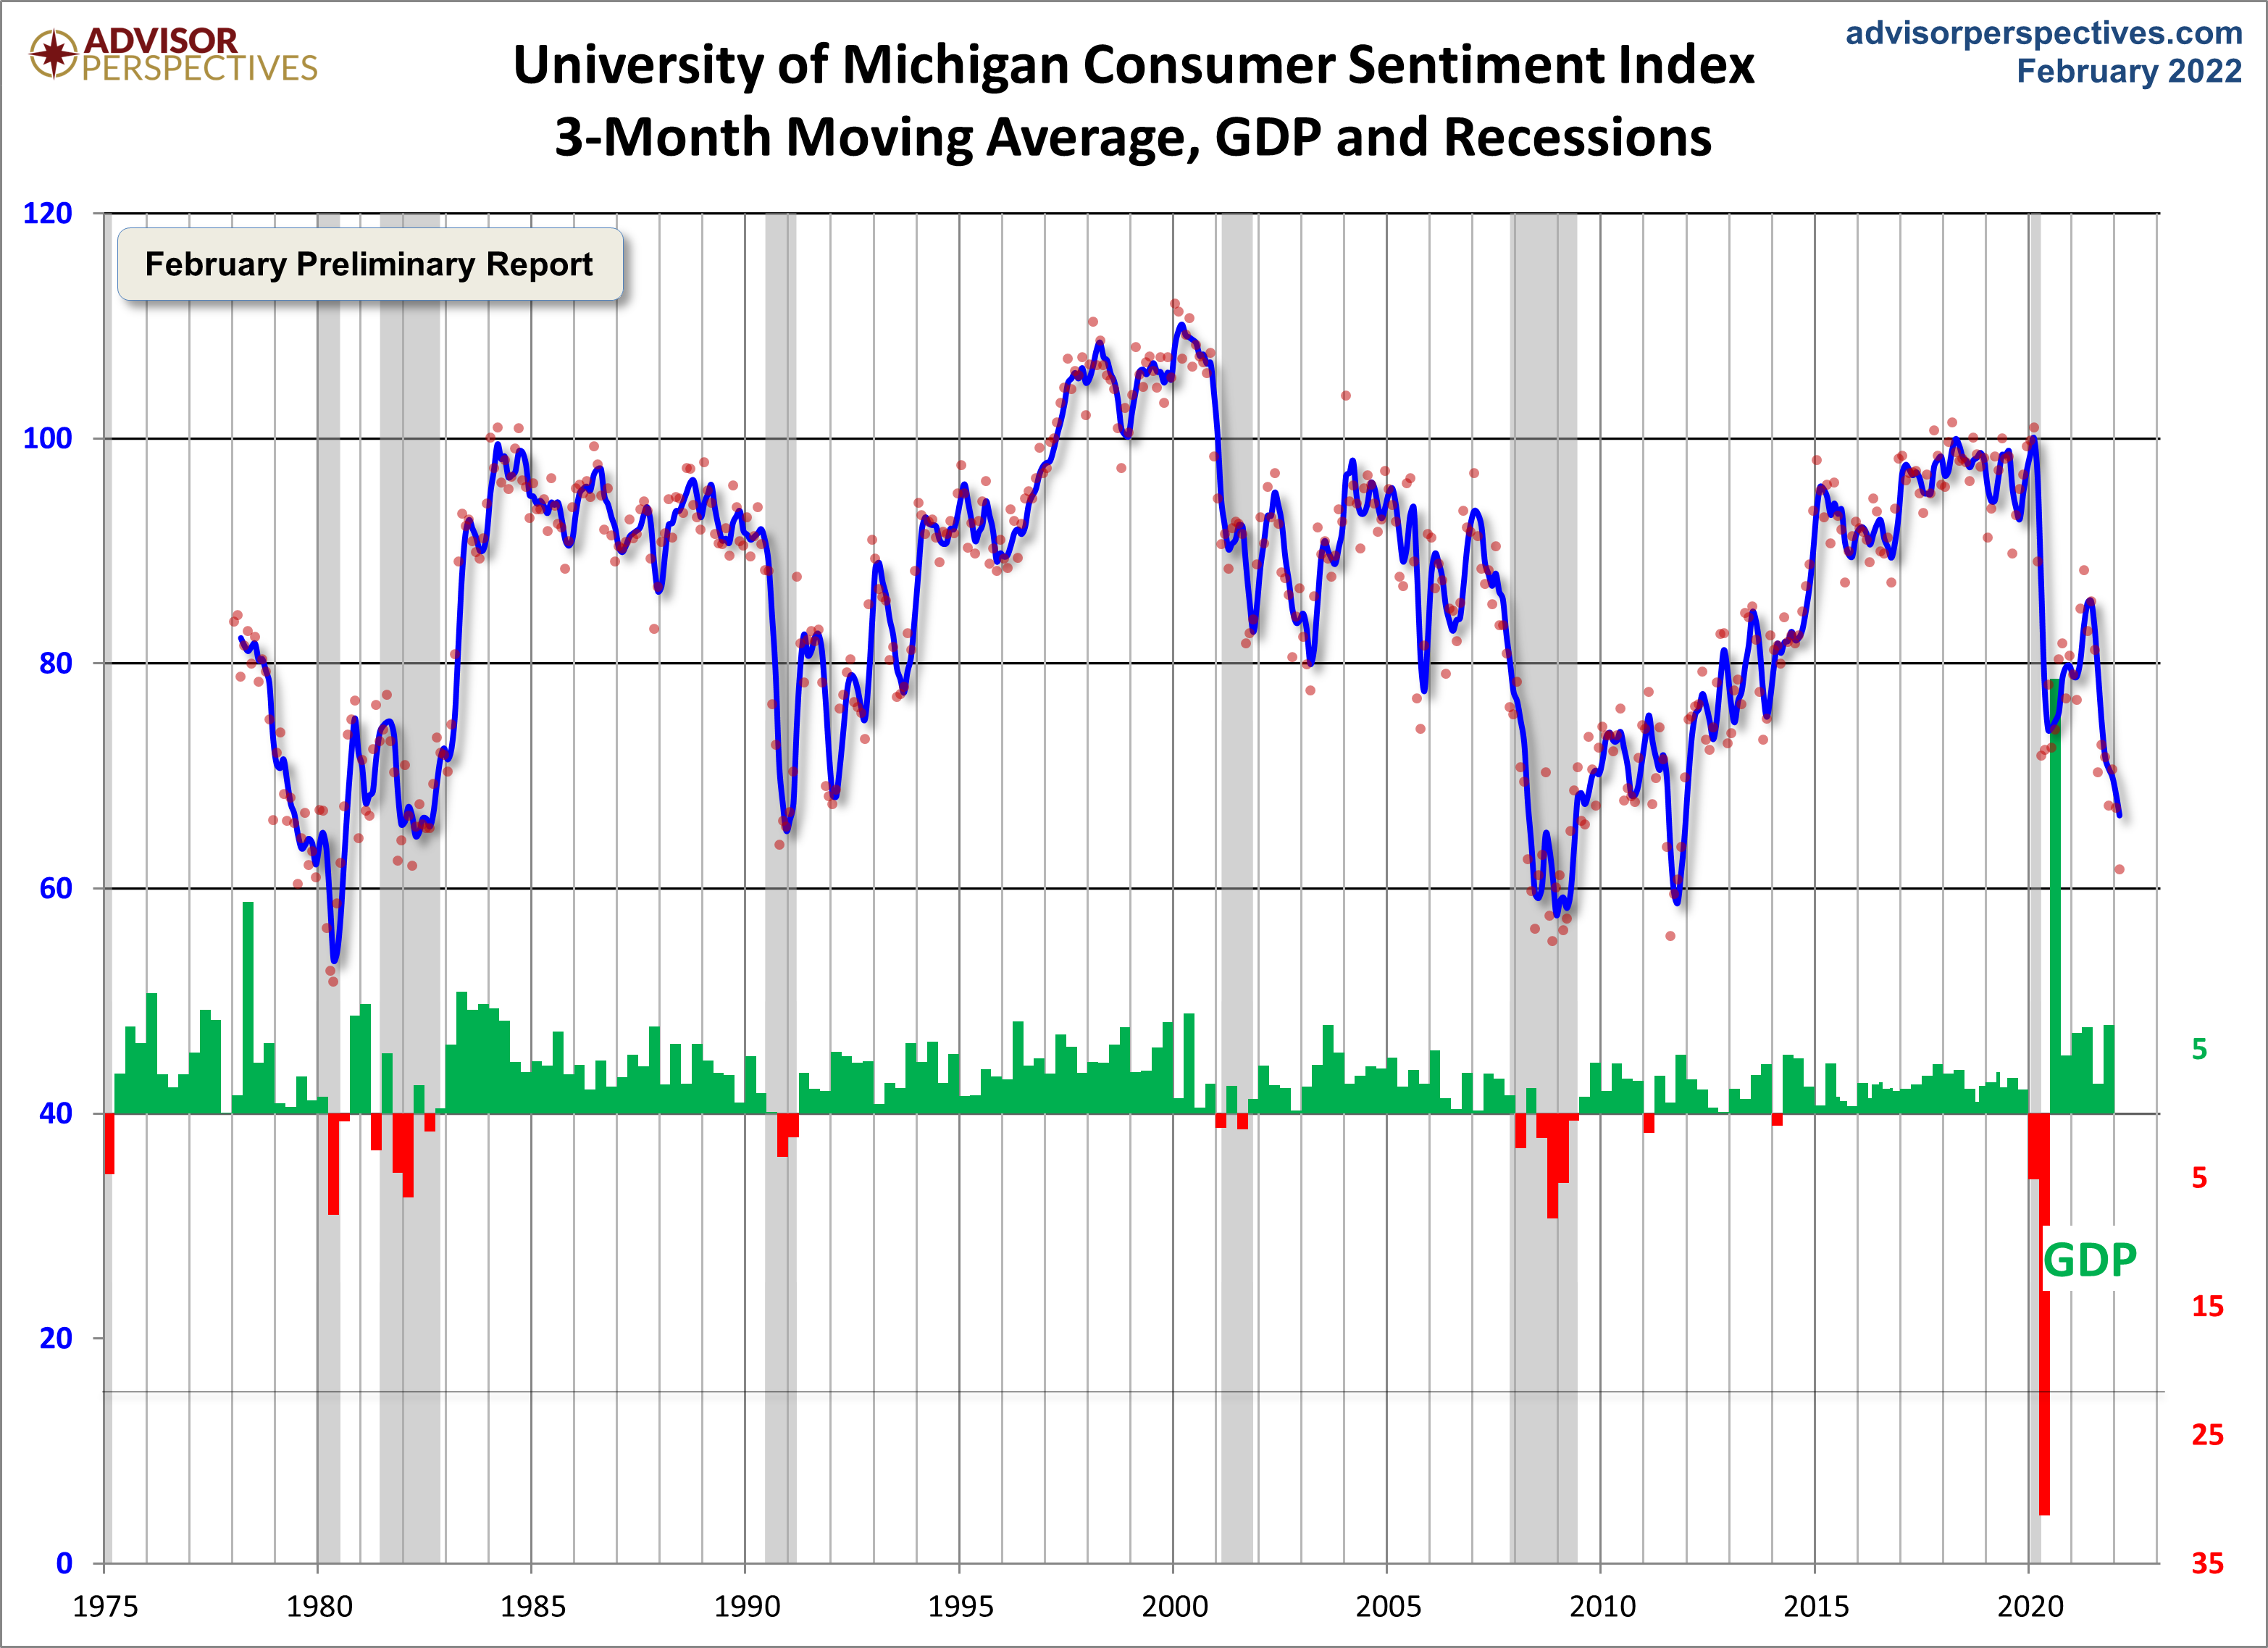
Note that this indicator is somewhat volatile, with a 3.0 point absolute average monthly change. The latest data point saw a 5.5 point decrease from the previous month. For a visual sense of the volatility, here is a chart with the monthly data and a three-month moving average.
(Click on image to enlarge)
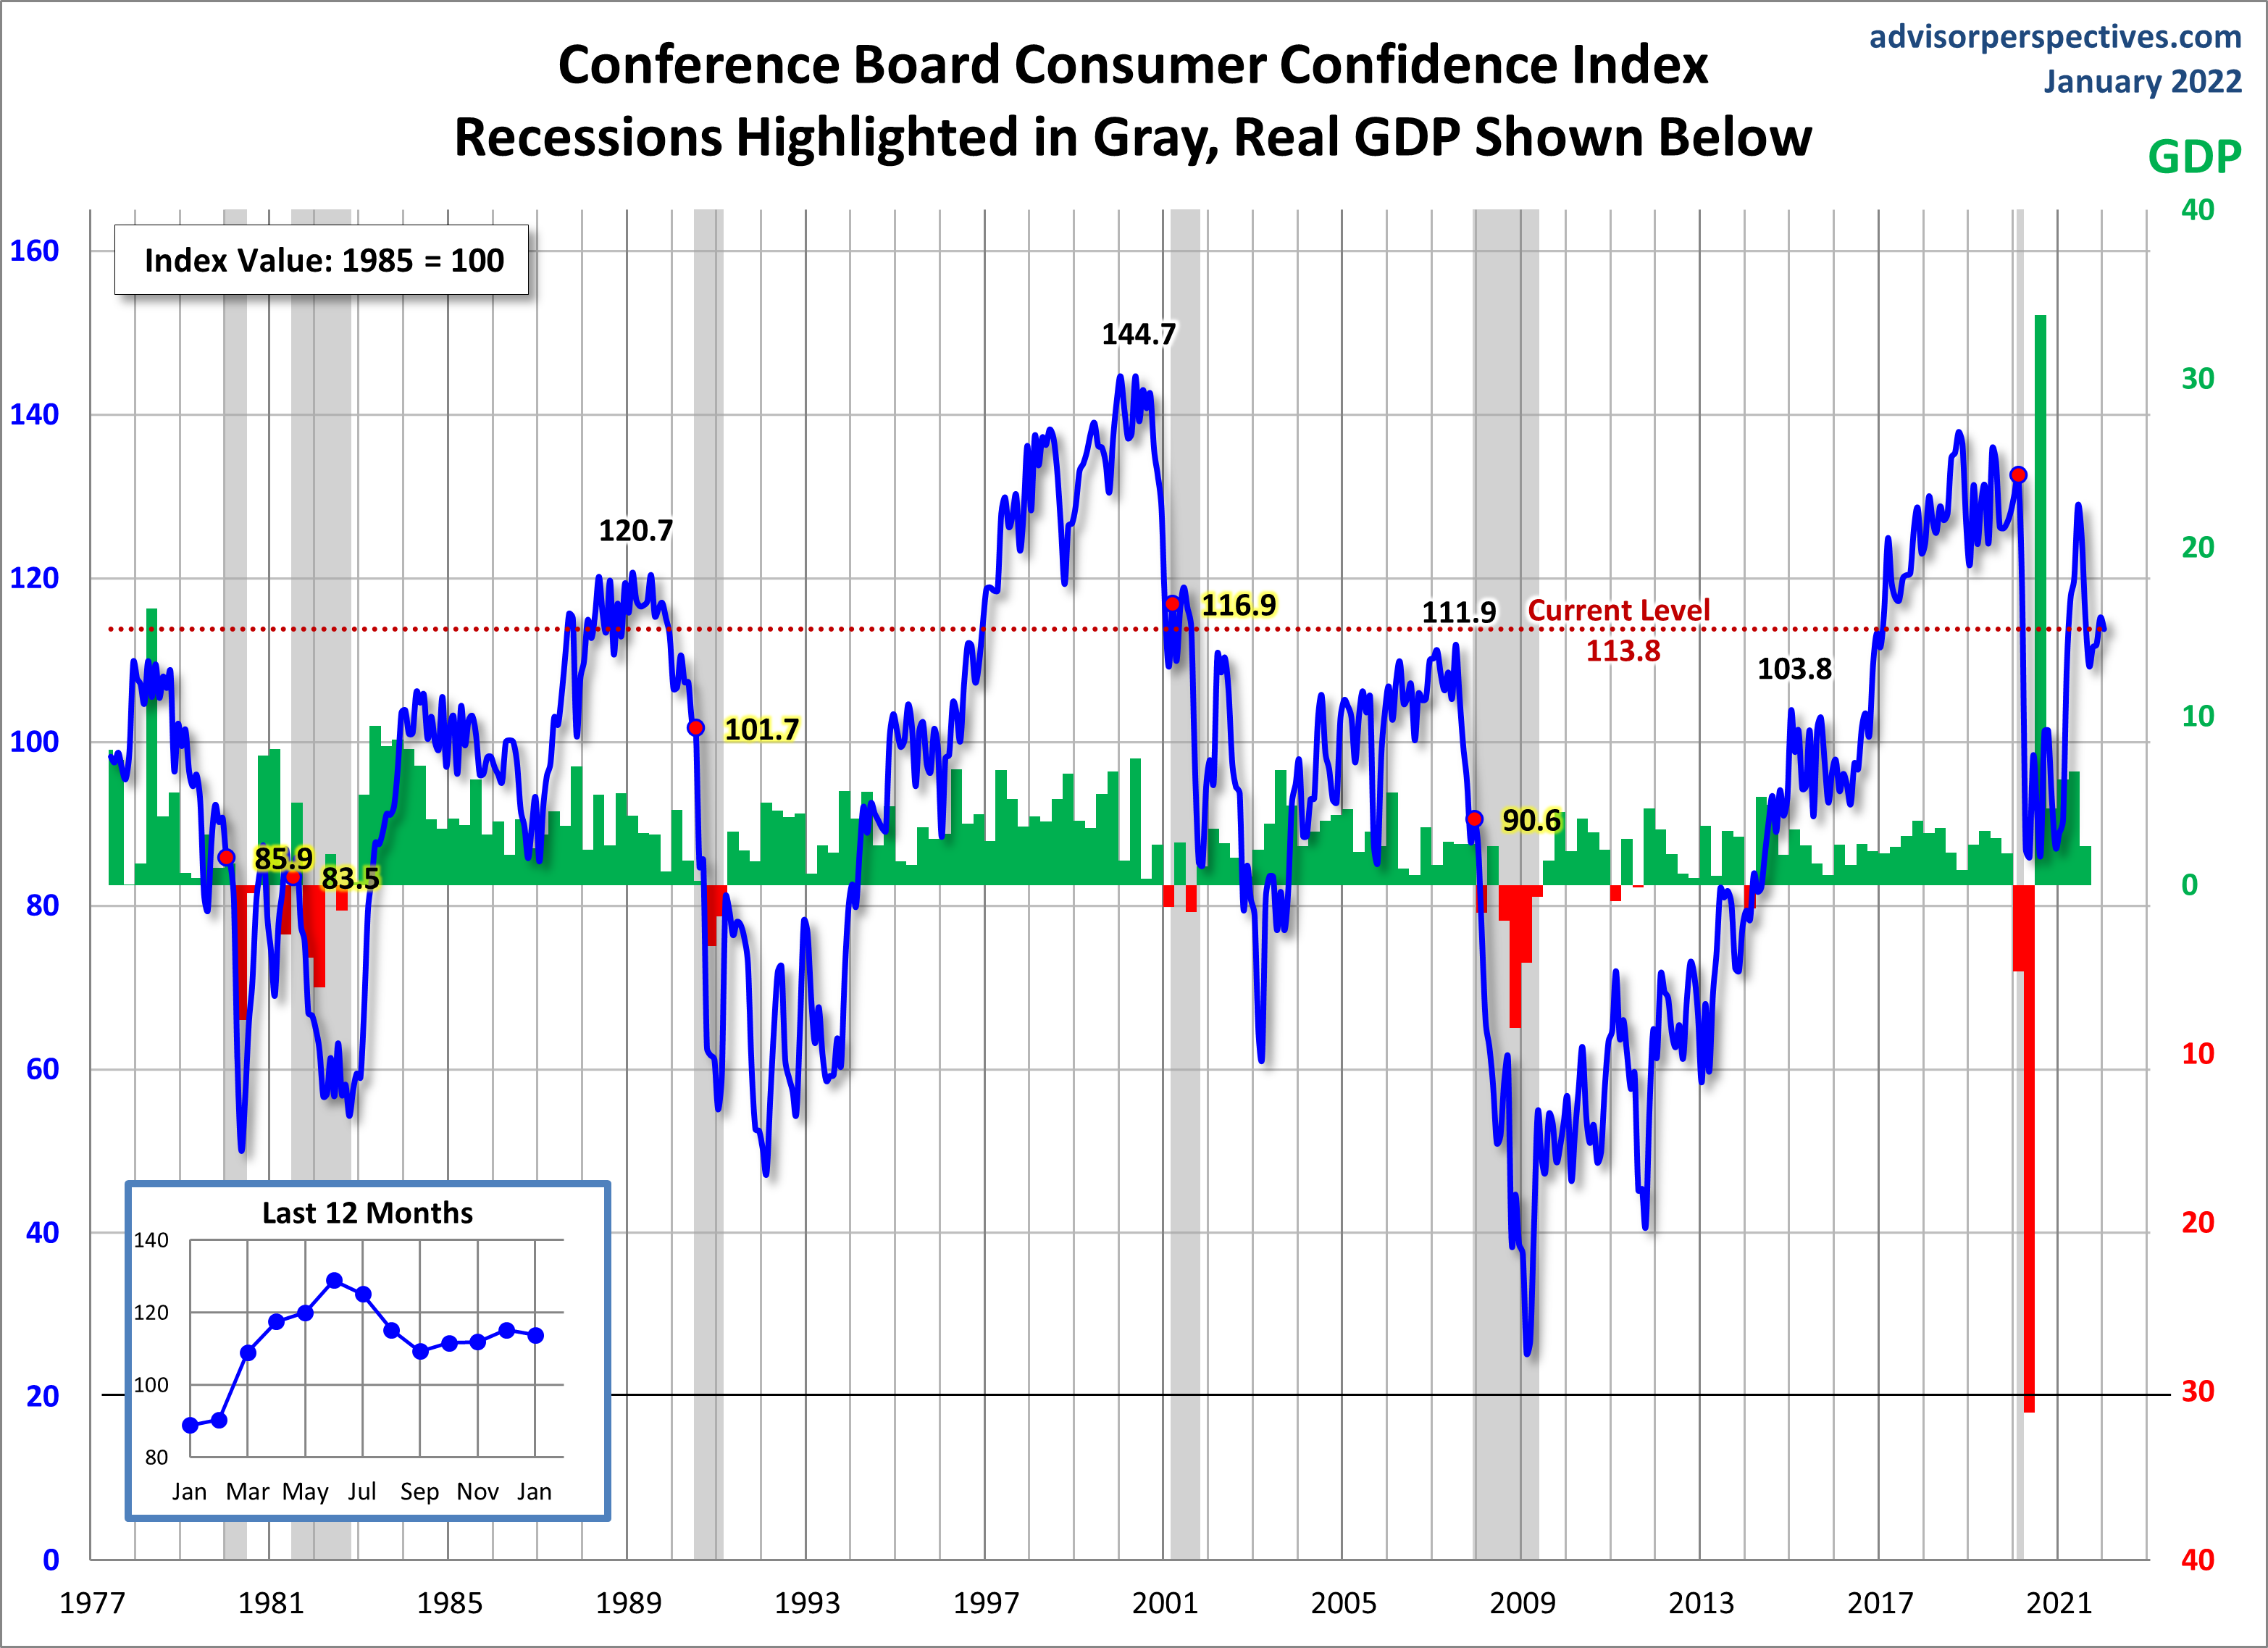
For the sake of comparison, here is a chart of the Conference Board's Consumer Confidence Index (monthly update here). The Conference Board Index is the more volatile of the two, but the broad pattern and general trends have been remarkably similar to the Michigan Index.
(Click on image to enlarge)
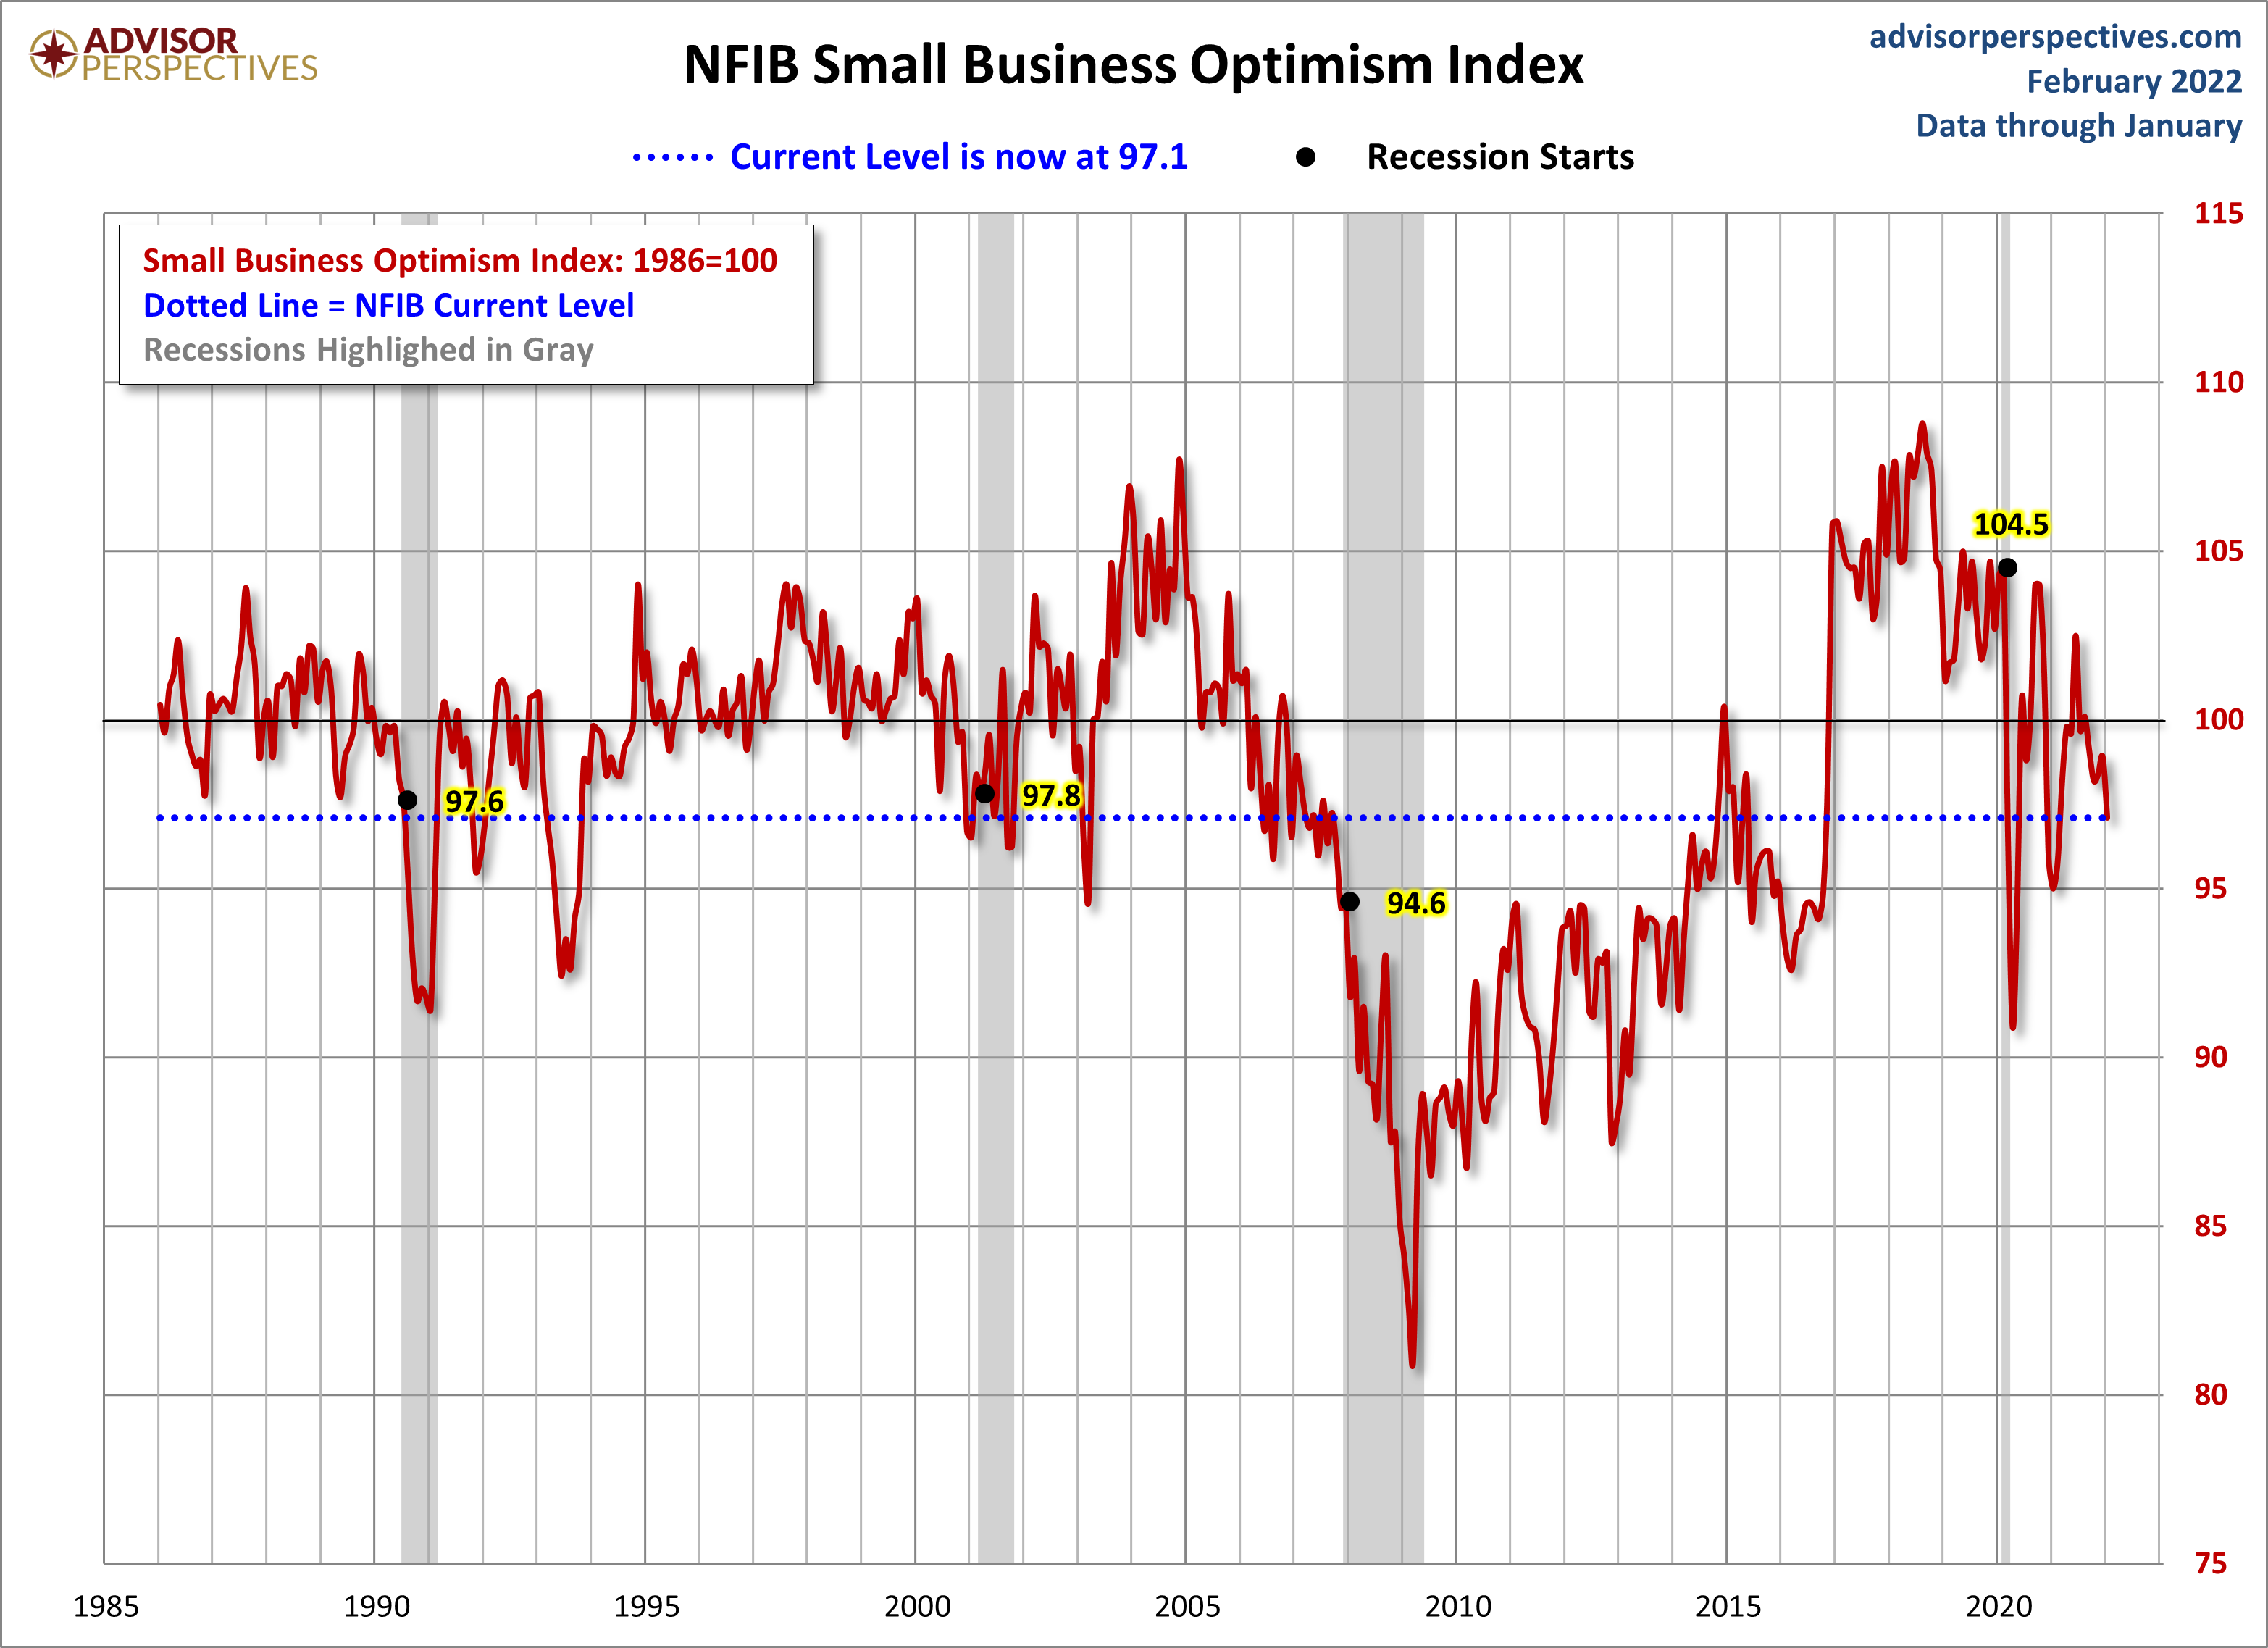
And finally, the prevailing mood of the Michigan survey is also similar to the mood of small business owners, as captured by the NFIB Business Optimism Index (monthly update here).
(Click on image to enlarge)


Comments
Log in or sign up to join the conversation.