
The June Preliminary Report came in at 50.2, down 8.2 (14%) from the May Final. Investing.com had forecast 58. Since its beginning in 1978, consumer sentiment is 41.4 percent below the average reading (arithmetic mean) and 40.7 percent below the geometric mean.
Surveys of Consumers chief economist, Richard Curtin, makes the following comments:
Consumer sentiment declined by 14% from May, continuing a downward trend over the last year and reaching its lowest recorded value, comparable to the trough reached in the middle of the 1980 recession. All components of the sentiment index fell this month, with the steepest decline in the year-ahead outlook in business conditions, down 24% from May. Consumers' assessments of their personal financial situation worsened about 20%. Forty-six percent of consumers attributed their negative views to inflation, up from 38% in May; this share has only been exceeded once since 1981, during the Great Recession. Overall, gas prices weighed heavily on consumers, which was no surprise given the 65 cent increase in national gas prices from last month (AAA). Half of all consumers spontaneously mentioned gas during their interviews, compared with 30% in May and only 13% a year ago. Consumers expect gas prices to continue to rise a median of 25 cents over the next year, more than double the May reading and the second highest since 2015. In addition, a majority of consumers spontaneously mentioned supply shortages for the ninth consecutive month. [More...]
See the chart below for a long-term perspective on this widely watched indicator. Recessions and real GDP are included to help us evaluate the correlation between the Michigan Consumer Sentiment Index and the broader economy.
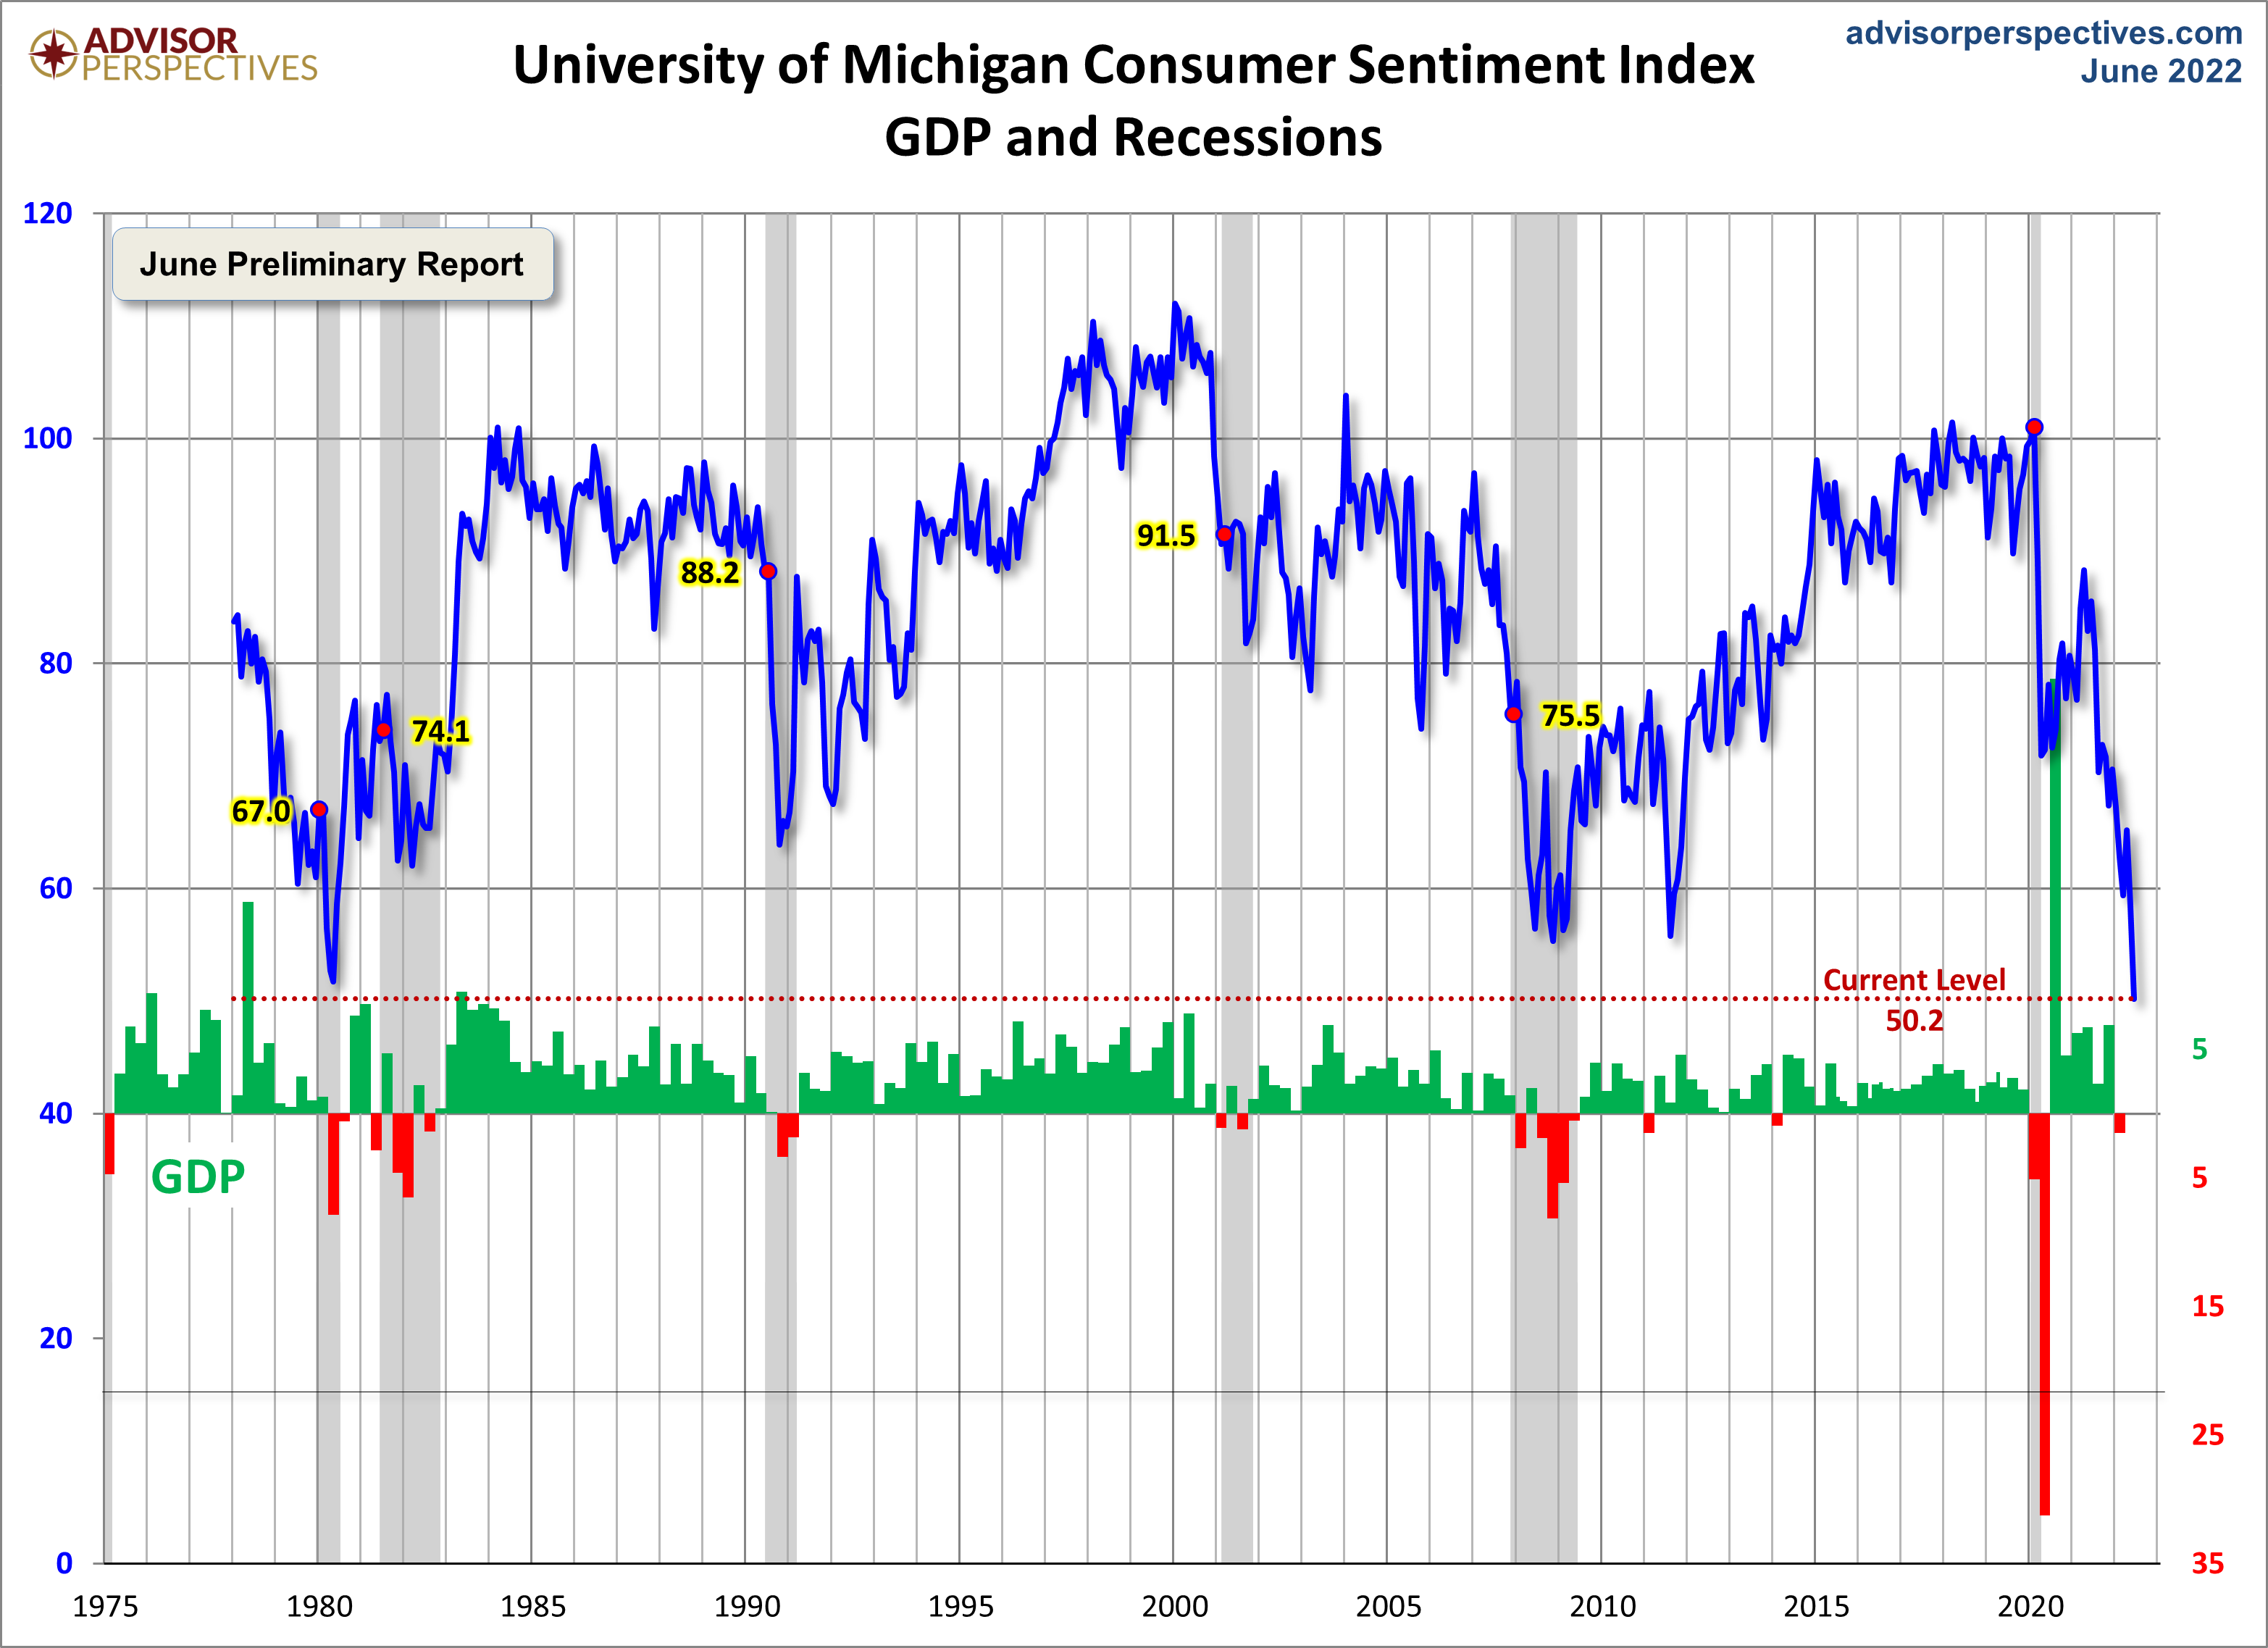
To put today's report into the larger historical context since its beginning in 1978, consumer sentiment is 41.4 percent below the average reading (arithmetic mean) and 40.7 percent below the geometric mean. The current index level is at the null percentile of the 534 monthly data points in this series.
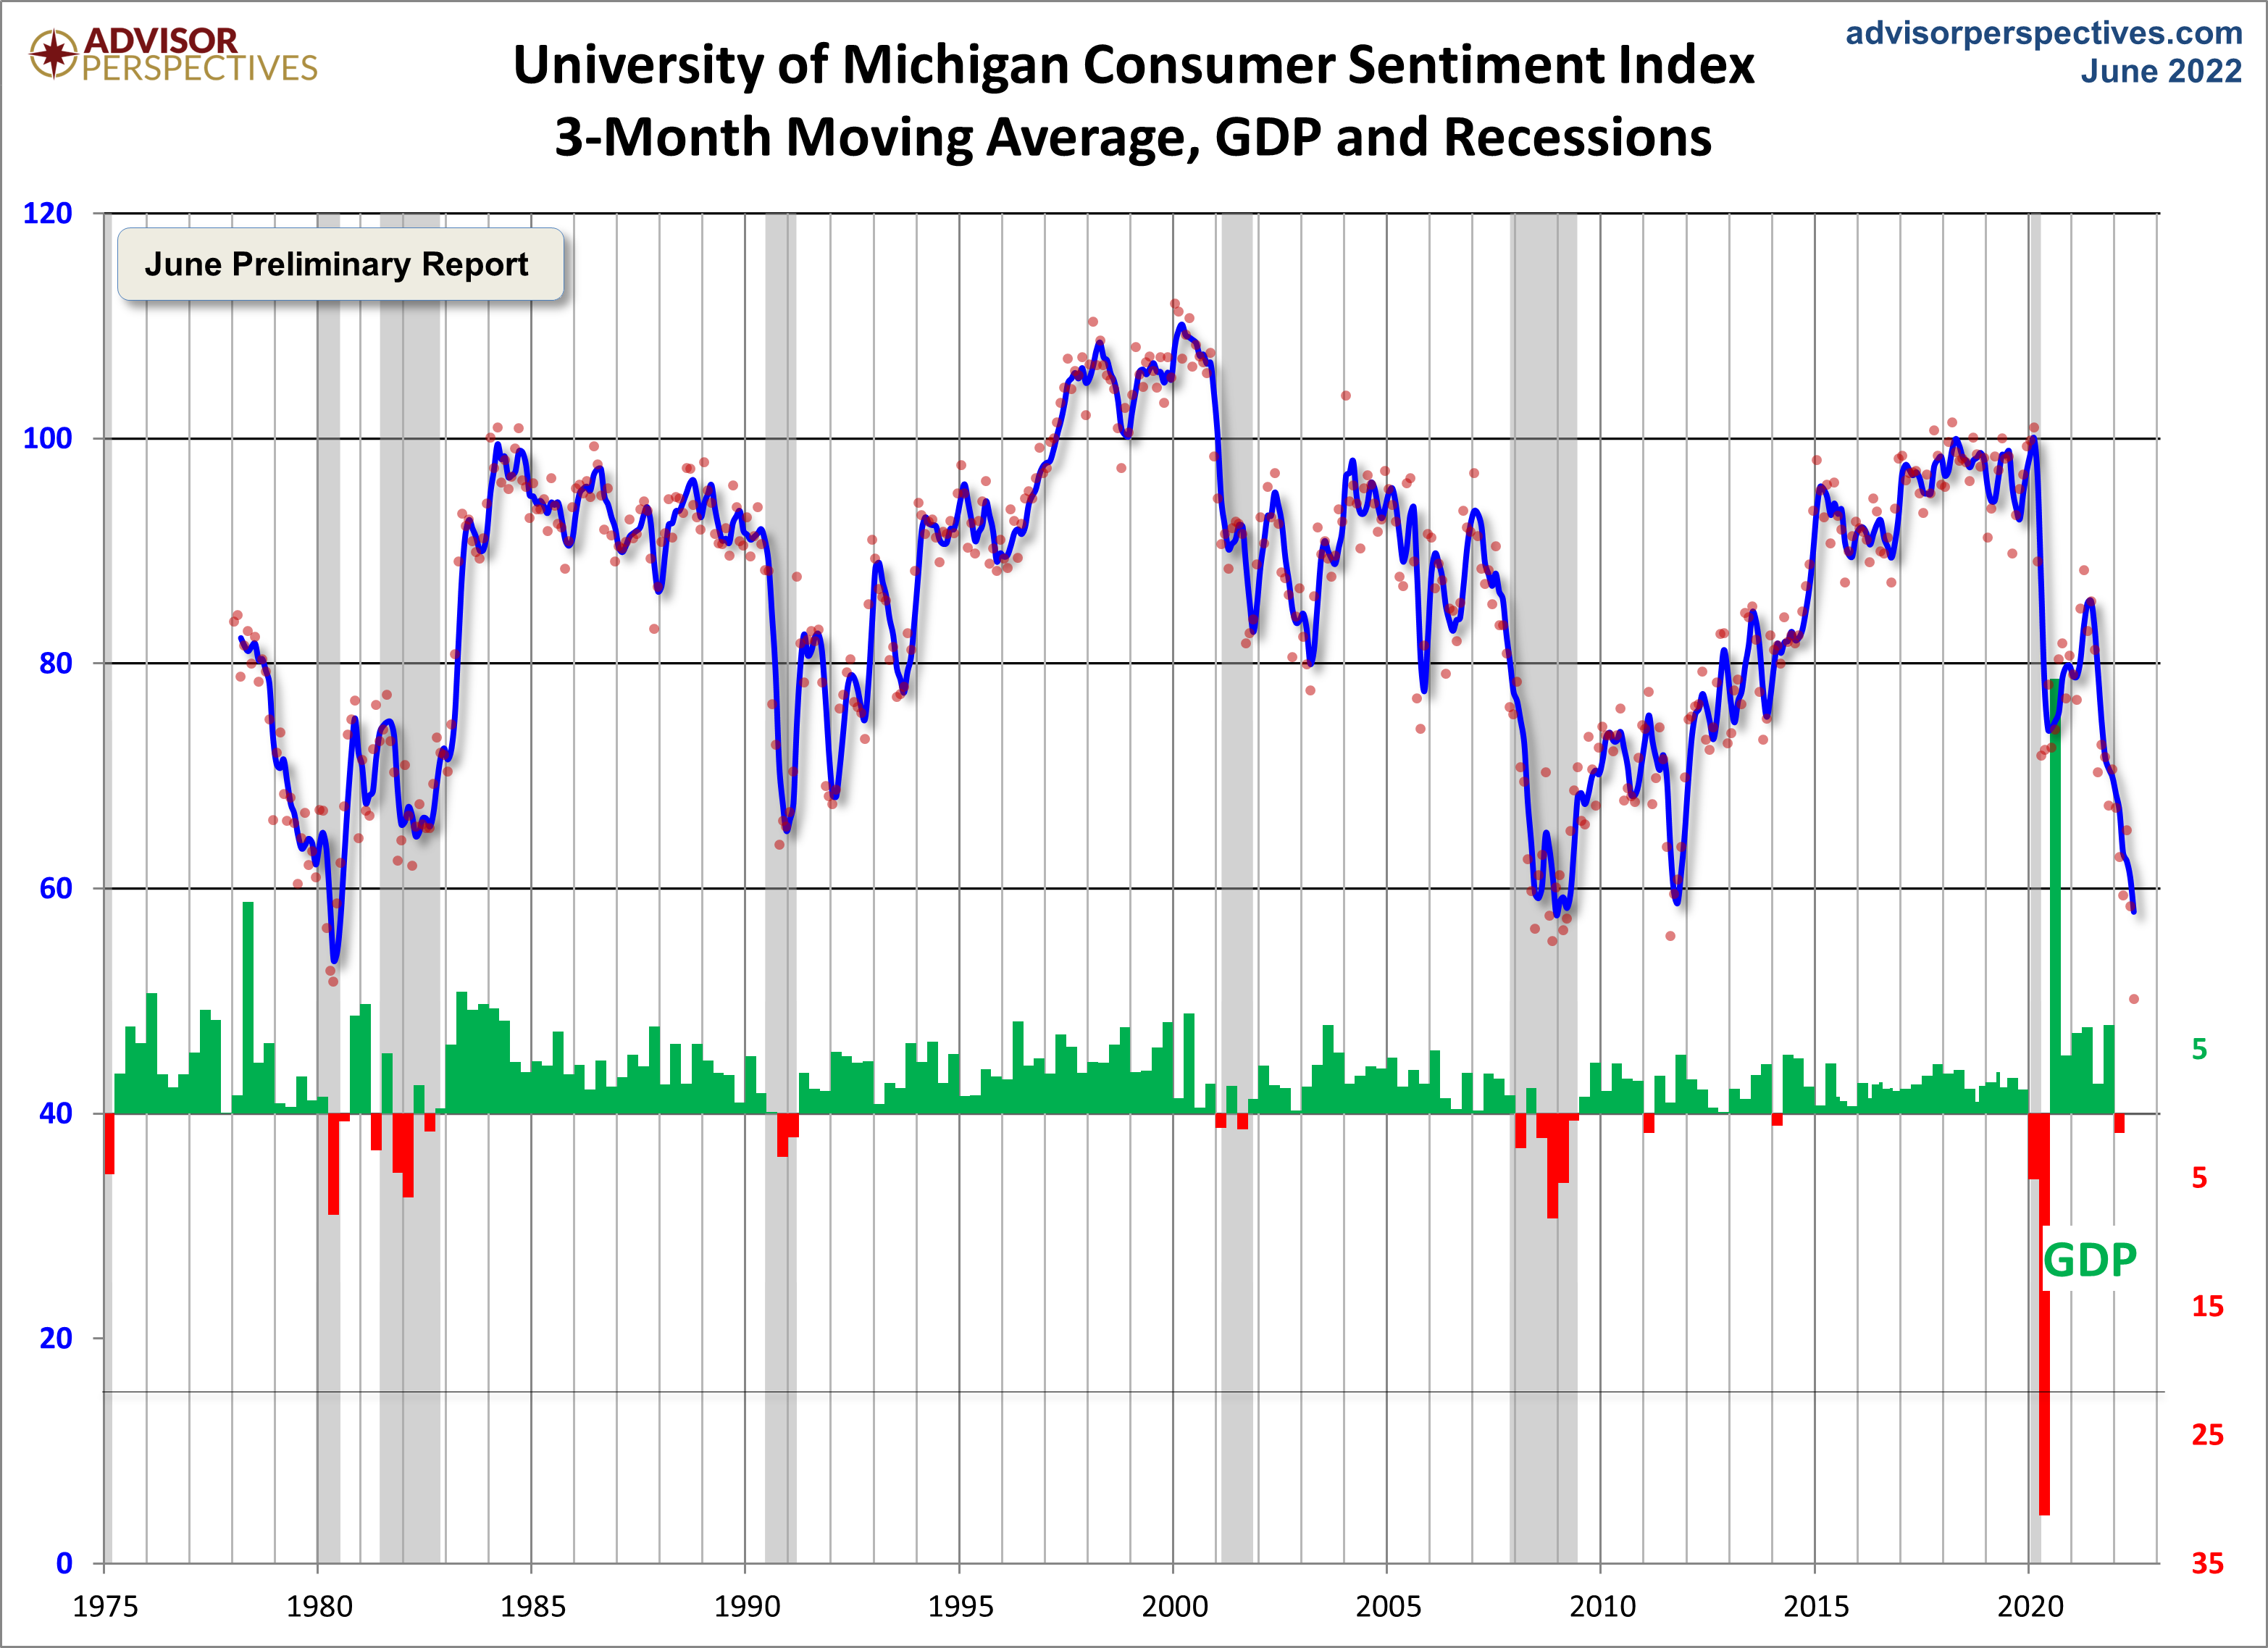
Note that this indicator is somewhat volatile, with a 3.0 point absolute average monthly change. The latest data point saw a 8.2 point decrease from the previous month. For a visual sense of the volatility, here is a chart with the monthly data and a three-month moving average.
For the sake of comparison, here is a chart of the Conference Board's Consumer Confidence Index (monthly update here). The Conference Board Index is the more volatile of the two, but the broad pattern and general trends have been remarkably similar to the Michigan Index.

And finally, the prevailing mood of the Michigan survey is also similar to the mood of small business owners, as captured by the NFIB Business Optimism Index (monthly update here).


Comments
Log in or sign up to join the conversation.