

The August Preliminary came in at 72.8, up 0.3 from the July Final. Investing.com had forecast 72.0.
Surveys of Consumers chief economist, Richard Curtin, makes the following comments:
Consumer sentiment remained largely unchanged in early August from the July reading (+0.3 points) or the April low (+1.0). Two significant changes since April have been that consumers have become more pessimistic about the five-year economic outlook (-18 points) and more optimistic about buying conditions (+21). Lower interest rates by the Fed prompted more favorable buying, especially for homes, and the DC policy gridlock was responsible for the weaker outlook. The overall confidence in economic policies fell to the lowest level since Trump first entered office (see the chart). The policy gridlock has acted to increase uncertainty and heightened the need for precautionary funds to offset lapses in economic relief programs and to hedge against fears about the persistence and spread of the coronavirus as the school year gets underway. Bad economic times are anticipated to persist not only during the year ahead, but the majority of consumers expect no return to a period of uninterrupted growth over the next five years. Consumers anticipate declines in the national unemployment rate to significantly slow and expect a rising rate of inflation during the year ahead. While a positive growth rate in consumption is anticipated in the 2nd half of 2020, it will hardly herald the end of the coronavirus recession. [More...]
See the chart below for a long-term perspective on this widely watched indicator. Recessions and real GDP are included to help us evaluate the correlation between the Michigan Consumer Sentiment Index and the broader economy.
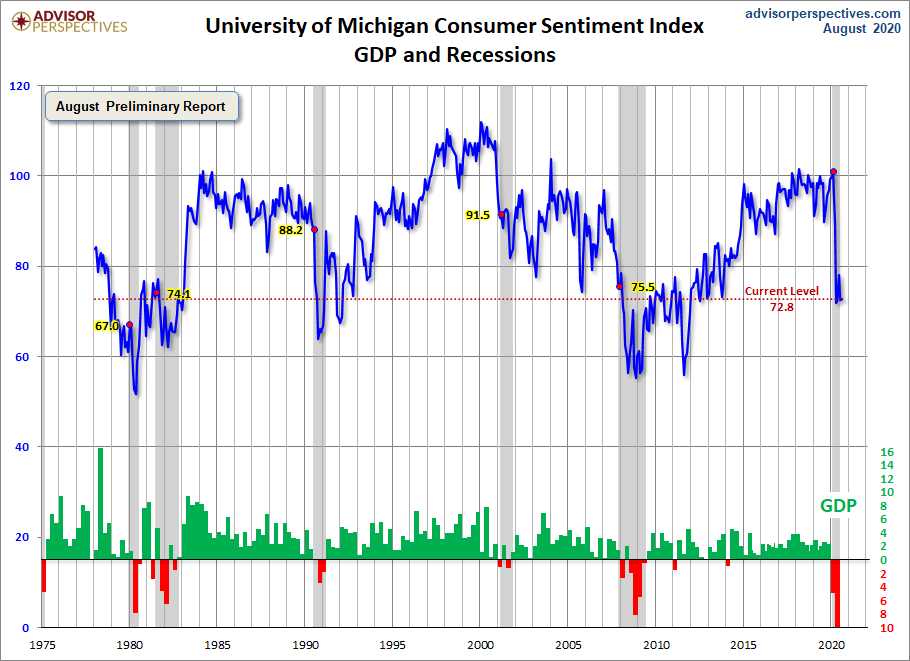
To put Friday's report into the larger historical context since its beginning in 1978, consumer sentiment is 15.6 percent below the average reading (arithmetic mean) and 14.6 percent below the geometric mean. The current index level is at the 18th percentile of the 512 monthly data points in this series.
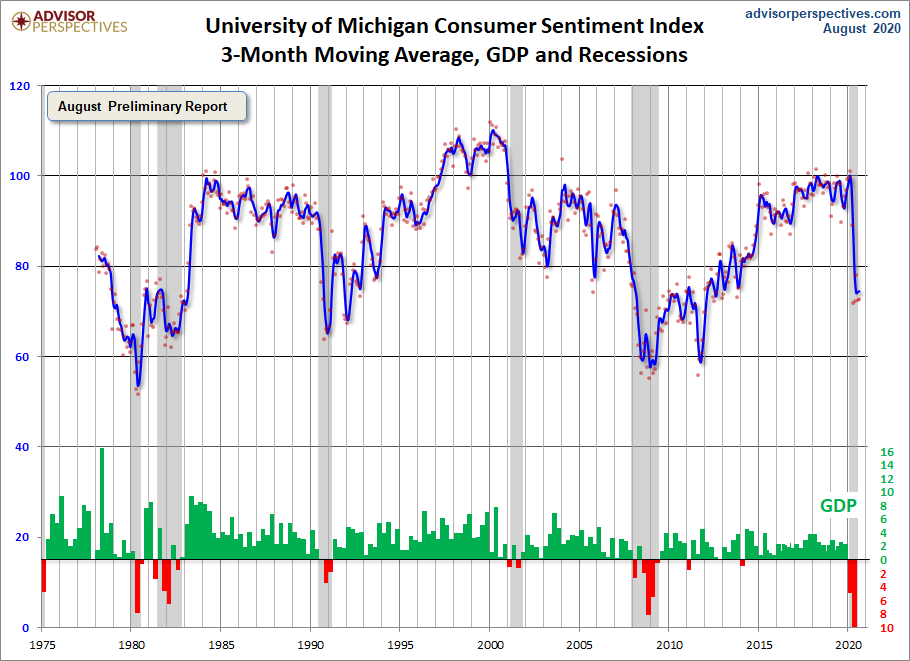
Note that this indicator is somewhat volatile, with a 3.0 point absolute average monthly change. The latest data point saw a 0.3 point increase from the previous month. For a visual sense of the volatility, here is a chart with the monthly data and a three-month moving average.
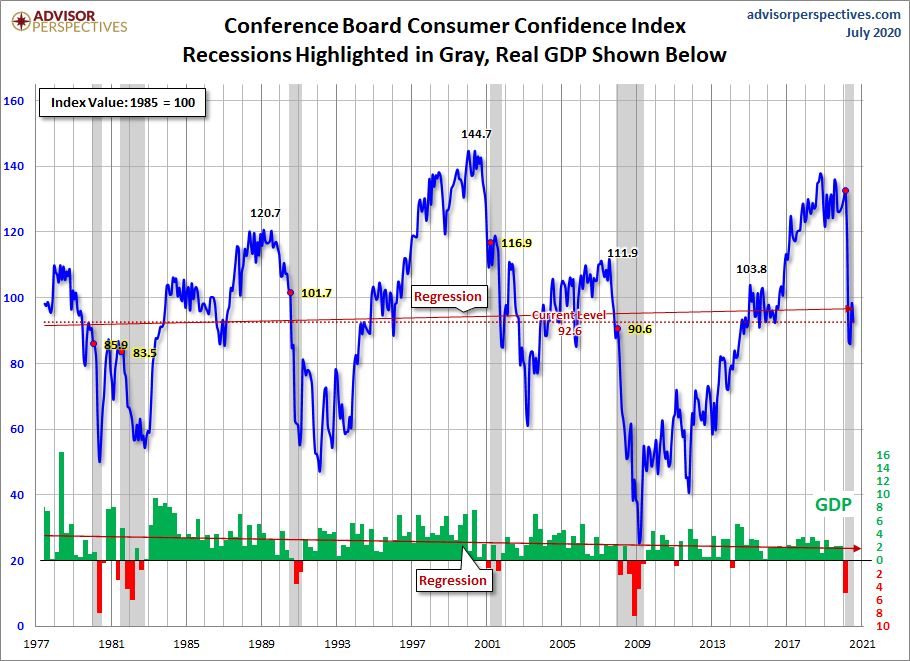
For the sake of comparison, here is a chart of the Conference Board's Consumer Confidence Index (monthly update here). The Conference Board Index is the more volatile of the two, but the broad pattern and general trends have been remarkably similar to the Michigan Index.
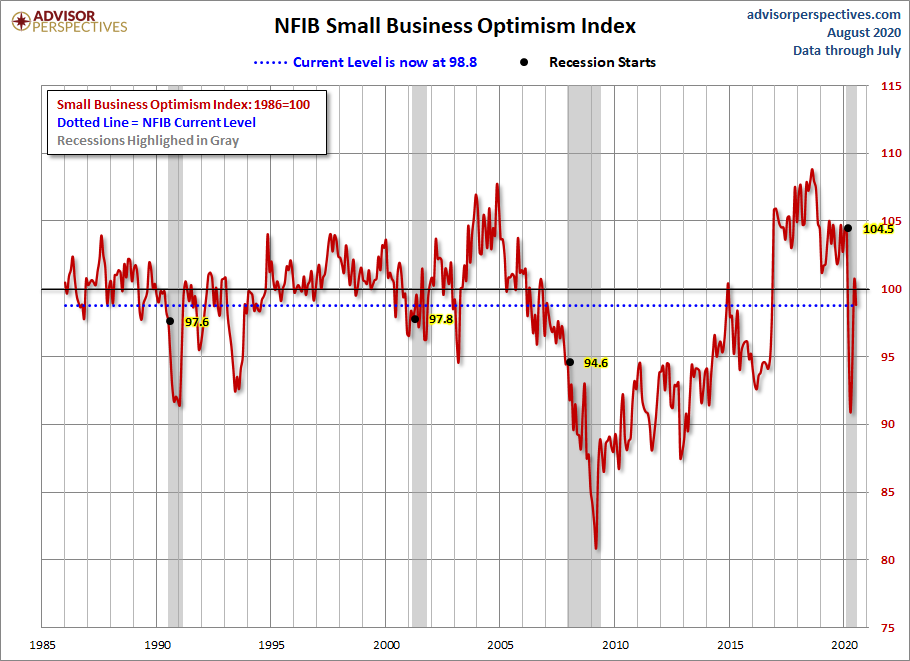
And finally, the prevailing mood of the Michigan survey is also similar to the mood of small business owners, as captured by the NFIB Business Optimism Index (monthly update here).
The next update to this report will be published on August 28.



Comments
Log in or sign up to join the conversation.