
The University of Michigan Final Consumer Sentiment for August came in at 96.8, up from the July Final reading of 93.4. Investing.com had forecast 97.4.
Surveys of Consumers chief economist, Richard Curtin, makes the following comments:
Consumer confidence has remained at a very favorable level, although slipping somewhat from mid-month. The Sentiment Index has been higher during the first eight months of 2017 than in any year since 2000, which was the peak year of the longest expansion in U.S. history. The renewed strength in 2017 was mainly due to consumers' favorable assessments of their own financial situations. Lows in unemployment, inflation, and interest rates, as well as renewed gains in the value of their homes and stock portfolios, pushed personal financial evaluations to near all-time peaks. When asked about news of recent developments, surprisingly few consumers made any reference to Charlottesville, North Korea, or Harvey-although too few interviews were conducted to fully assess the storm's ultimate impact. Harvey may diminish the 3rd quarter pace of economic growth, and higher gas prices will directly impact consumers. Prior to the storm, consumers anticipated no increase in gas prices in the year ahead (an expected change of just +0.4 cents). Given the current resilience of consumers, temporary increases in gas prices as well as a brief period of weakness in economic growth and employment are unlikely to derail confidence. Nonetheless, all of these events are more likely to increase precautionary motives and to slightly temper spending trends. [More...]
See the chart below for a long-term perspective on this widely watched indicator. Recessions and real GDP are included to help us evaluate the correlation between the Michigan Consumer Sentiment Index and the broader economy.
(Click on image to enlarge)
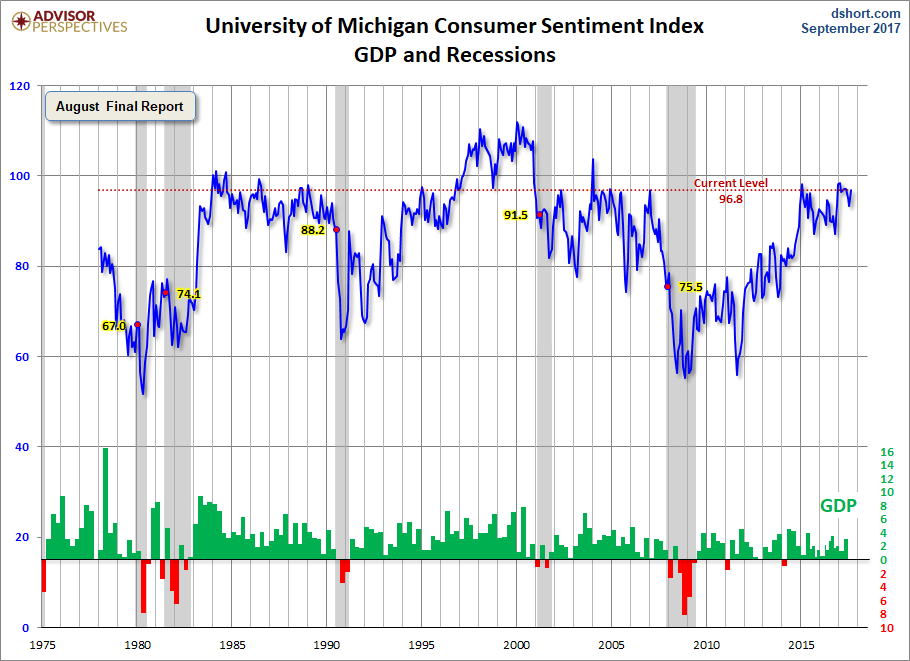
To put today's report into the larger historical context since its beginning in 1978, consumer sentiment is 13.0 percent above the average reading (arithmetic mean) and 14.3 percent above the geometric mean. The current index level is at the 85th percentile of the 476 monthly data points in this series.
The Michigan average since its inception is 85.6. During non-recessionary years the average is 87.8. The average during the five recessions is 69.3. So the latest sentiment number puts us 27.5 points above the average recession mindset and 9.0 points below the non-recession average.
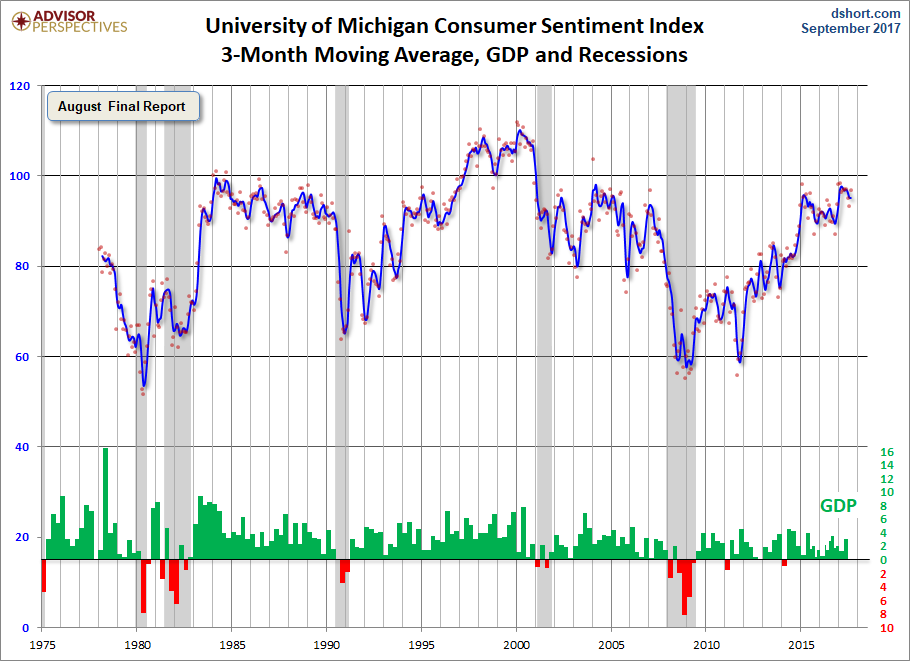
Note that this indicator is somewhat volatile, with a 3.0 point absolute average monthly change. The latest data point saw a 3.4 percent change from the previous month. For a visual sense of the volatility, here is a chart with the monthly data and a three-month moving average.
(Click on image to enlarge)
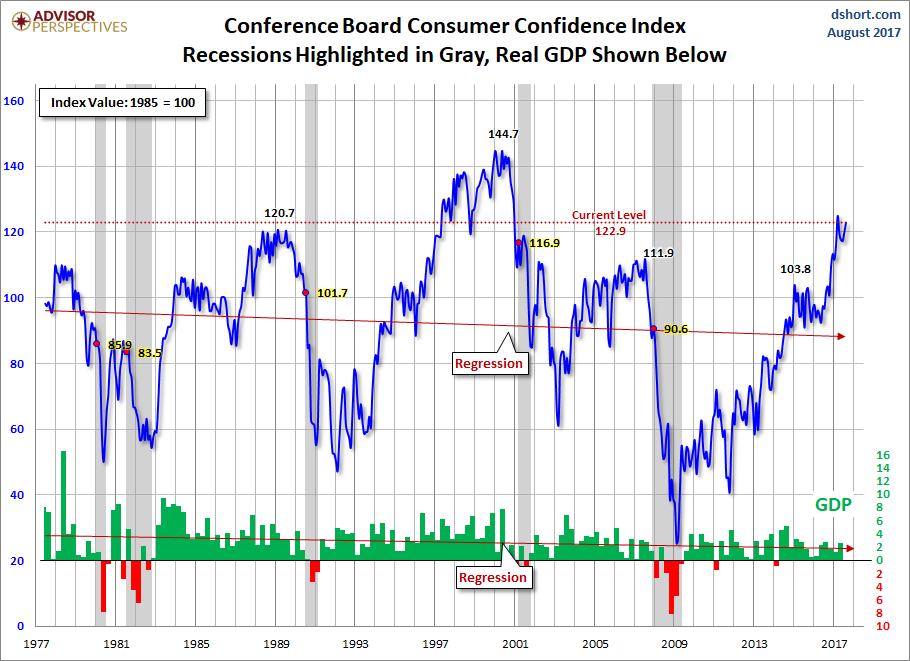
For the sake of comparison, here is a chart of the Conference Board's Consumer Confidence Index (monthly update here). The Conference Board Index is the more volatile of the two, but the broad pattern and general trends have been remarkably similar to the Michigan Index.
(Click on image to enlarge)
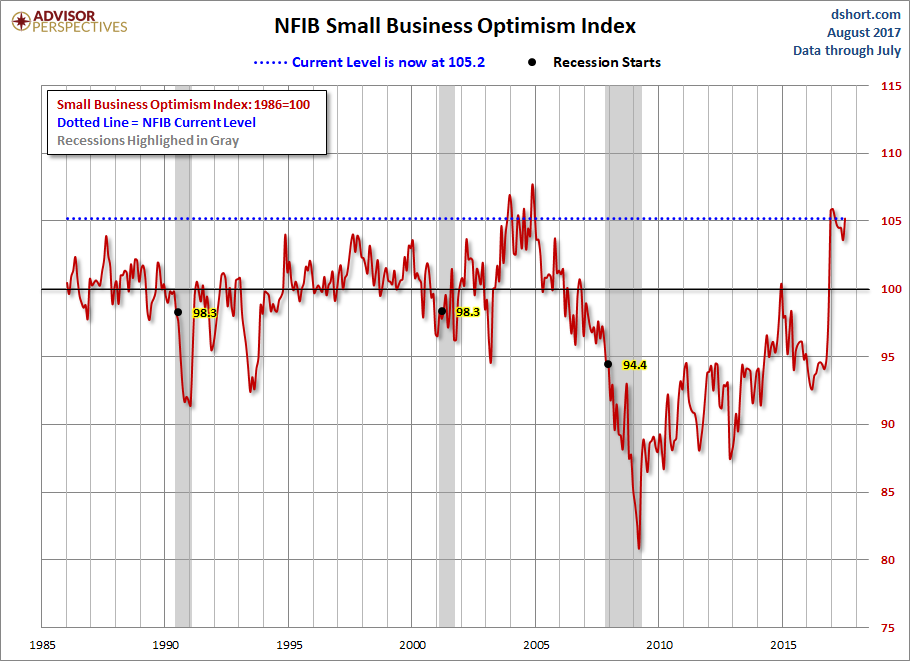
And finally, the prevailing mood of the Michigan survey is also similar to the mood of small business owners, as captured by the NFIB Business Optimism Index (monthly update here).
(Click on image to enlarge)
The general trend in the Michigan Sentiment Index since the Financial Crisis lows has been one of slow improvement.The survey findings since December 2015 saw gradual decline followed by a bounceback later in the year with its interim peak in January of 2017.


Comments
Log in or sign up to join the conversation.