


The Mexican Peso loses traction against the Greenback, dropping over 0.65% during Friday’s North American session as the American currency benefits due to its safe-haven appeal as the US-Iran conflict is far from ending, despite holding talks to finish the war. The USD/MXN trades at 17.53, after bouncing off a daily low of 17.41.
USD/MXN rises as Oil risks revive Dollar and Fed support
Market sentiment deteriorated amid a sell-off on chip stocks. The rise in Oil prices fueled speculation that the Federal Reserve could hike rates and narrow the interest rate differential, which favoured the Mexican Peso, as it began its appreciation cycle early in 2025.
Benign US inflation data was cheered by investors, which trimmed the odds of a Fed rate hike at the September meeting. However, the US and Iran are poised to continue fighting for the Strait of Hormuz, which could trigger another leg-up in Oil prices.
On Friday, the University of Michigan (UoM) revealed that US consumers are slightly more optimistic about current economic conditions and the outlook. The Consumer Sentiment Index in July increased from 50.7 to 54, while short- and medium-term inflation expectations eased.
The US Dollar Index (DXY), which measures the American currency's performance against a basket of six peers, rises modestly by 0.05% to 100.76, a tailwind for the USD/MXN exotic pair.
Meanwhile, Fed officials crossed the wires. Cleveland Fed President Beth Hammack was hawkish, expressing concern about persistent high inflation, which is at the top of her list, and saying, “Inflation is too high.” Hammack added that the labor market is solid and that “growth numbers are good and consumer spending is stable.”
In Mexico, the economic docket was absent, but the next week will feature the release of Retail Sales, employment data, and inflation for the first fifteen days of July. In the US, the schedule will feature jobs data and S&P Global Flash PMIs, as Federal Reserve officials entered their blackout period ahead of the July 29 policy meeting.
USD/MXN Price Forecast: Technical outlook
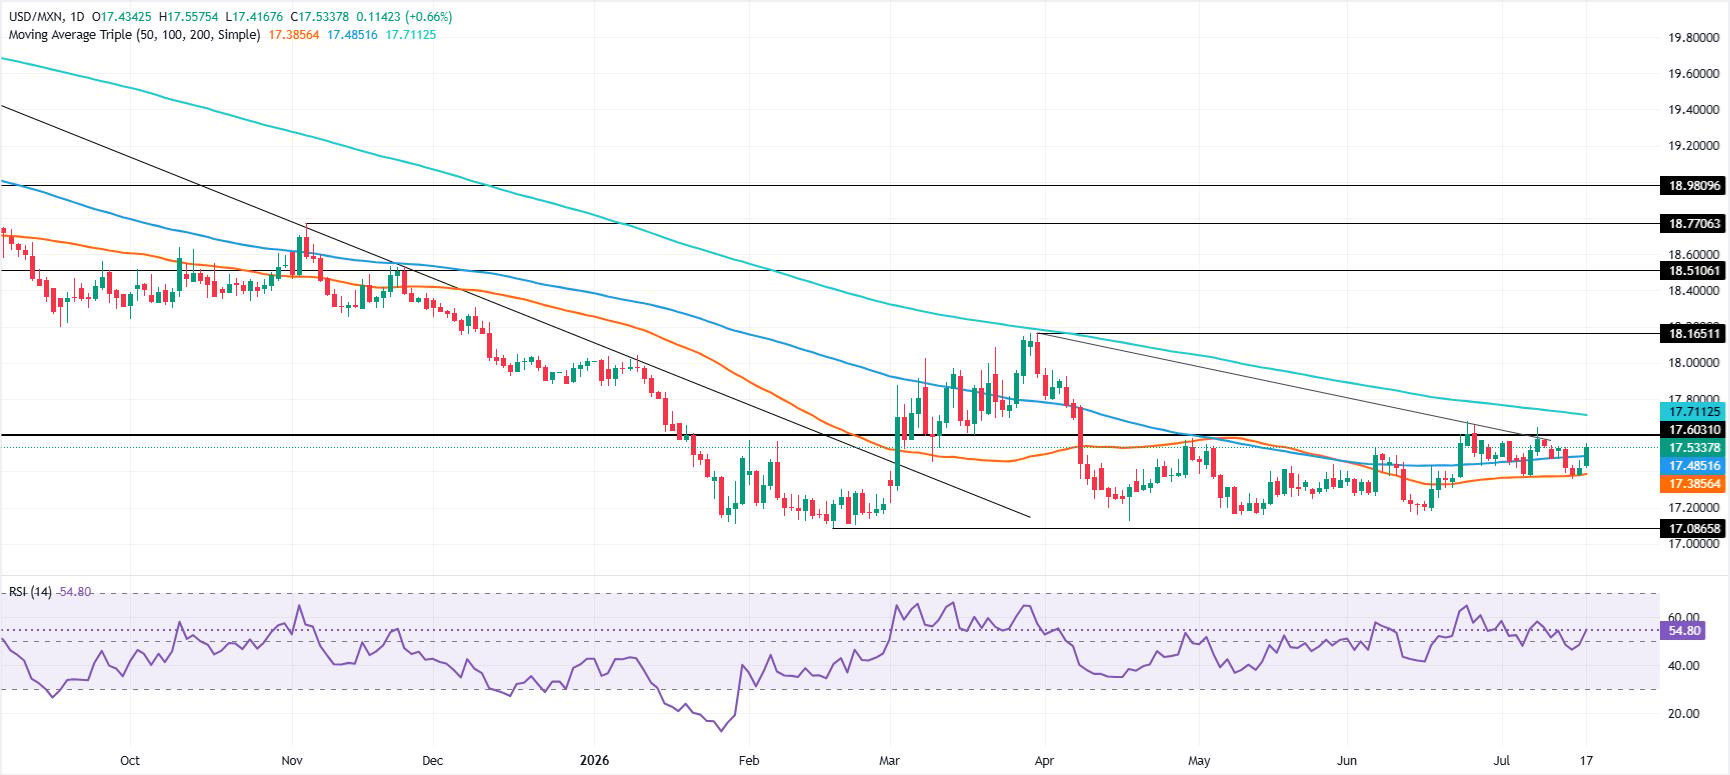
In the daily chart, USD/MXN trades at 17.5333, holding above the clustered 50/100/200-day simple moving averages (SMA) around 17.3856, which suggests a constructive near-term bias as the pair remains supported by its broader trend floor. Price is now testing the latest downward-sloping resistance trend line coming from the 18.1651 high, with that barrier emerging at 17.5456, while the Relative Strength Index (14) near 54.8 hints at mildly positive momentum without yet reaching overbought territory.
On the topside, immediate resistance is located at the near-term descending trend line at 17.5456, followed by a higher structural cap at the longer-term downward resistance drawn from 21.0808, currently coming in near 18.1200. On the downside, initial support is provided by the triple SMA cluster at 17.3856, and a sustained hold above this moving-average base would keep the bullish bias intact, whereas a daily close back below it would signal fading upside pressure and expose a deeper corrective phase.



Comments
Log in or sign up to join the conversation.