


The Mexican Peso (MXN) is poised to end Tuesday’s session with solid gains of 0.32% against the US Dollar (USD) as money markets await the release of the US July inflation figures, while USD/MXN trades at 17.08, a level last seen in June 2024.
USD/MXN weakens on stronger-than-expected Mexican output and hopes of a Fed pause, with traders awaiting US inflation data
Mexico’s Industrial Output for June improved from a 0.8% contraction to 0.2%, beneath forecasts of 0.3%. In the twelve months to June, output exceeded forecasts for a 1.1% increase, was 1.7%, crushing May’s -0.7% print.
The improvement in the data provided a leg down in the USD/MXN pair. Still, traders refrained from driving the exchange rate past the 17.00 milestone as they await the release of July’s US inflation data.
On Wednesday, the US economic calendar includes the release of inflation data. Expectations indicate that headline inflation will decline slightly from 3.5% to 3.4% year-over-year, while core figures are also expected to slow down from 2.6% to 2.5% over the twelve months ending in July.
If the data comes softer than expected, this would be positive for the Mexican Peso. The Federal Reserve (Fed) would not need to increase rates, and, as a result, amid the ongoing disinflation process, the interest rate differential will still favor the emerging-market currency.
The US Dollar index (DXY), which tracks the performance of the buck against six currencies, sits at 99.80 after touching a two-month low of 99.40.
Based on the Citi Mexico expectations survey, all analysts predict the Bank of Mexico's (Banxico) key policy rate will stay steady at 6.50% by the end of the year. The median forecast also suggests that the USD/MXN exchange rate will close this year at 17.90.
USD/MXN Price Forecast: Technical outlook
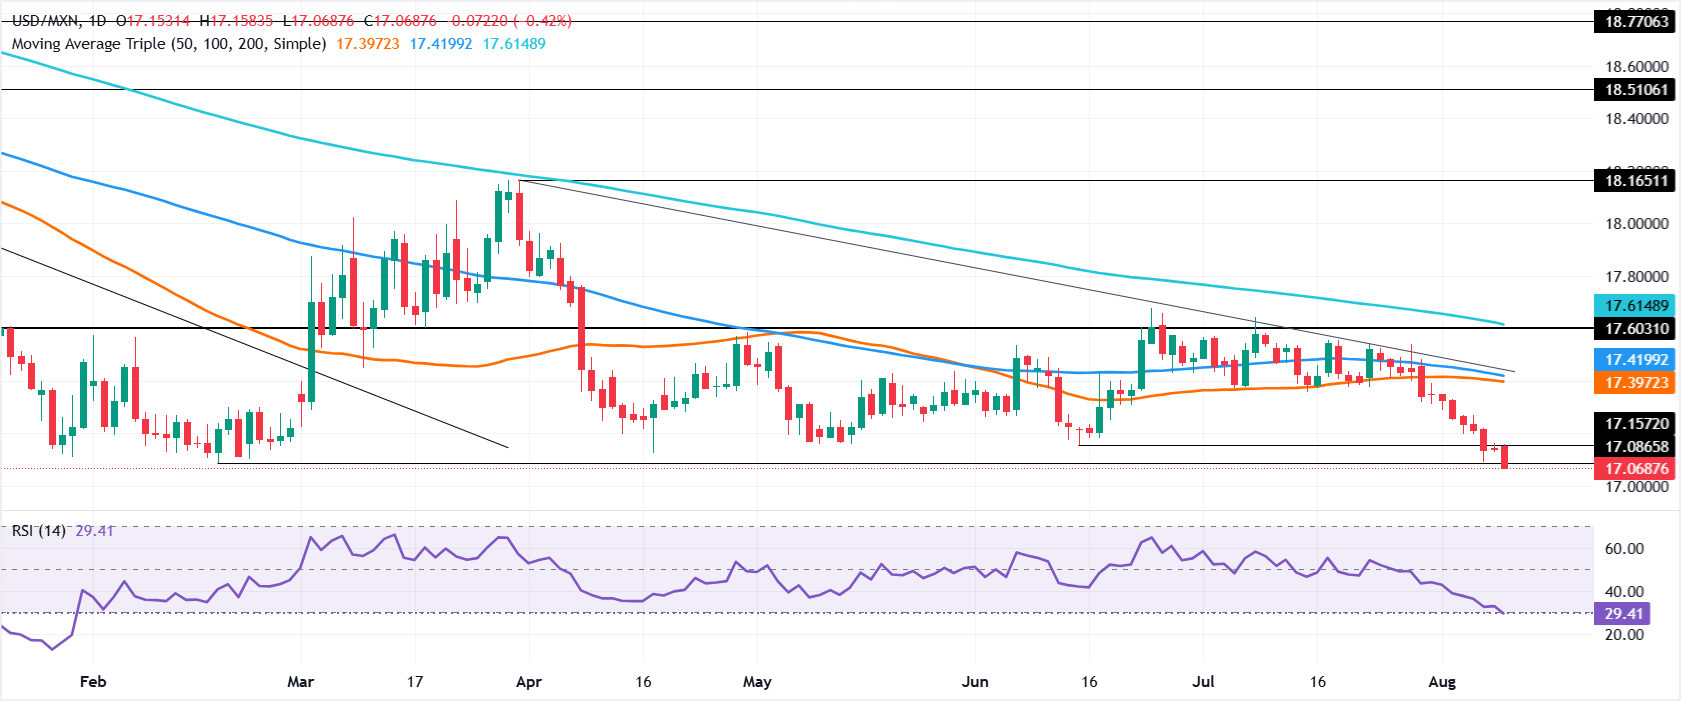
USD/MXN daily chart
In the daily chart, USD/MXN trades at 17.0688, extending its slide beneath the clustered simple moving averages, with the latest triple SMA reading around 17.3972 acting as overhead resistance. The pair also remains capped by a descending trend-line resistance coming in near 17.4359, while the Relative Strength Index (14) at 29.4 slips into oversold territory, hinting that bearish momentum is stretched but still dominant as long as spot holds below these structural caps.
On the downside, immediate focus sits on the current area around 17.07 as a pivotal level, with a deeper support zone emerging near the former resistance-turned-floor around 15.65 should selling pressure accelerate. On the topside, a recovery would first need to reclaim the triple simple moving average cluster at 17.40, followed by a break above the descending trend-line hurdle near 17.44 to ease the bearish bias and open room for a more sustained corrective bounce.



Comments
Log in or sign up to join the conversation.