

Good day Traders and Investors. In today’s article, we will look at the past performance of 1 Hour Elliottwave chart of Meta Platforms, Inc. ($META). The decline from 10.26.2022 high unfolded as 5 swings making a lower low within the 4H cycle from August 2022 peak which created a bearish sequence in the 1H timeframe. Therefore, we knew that the structure in $META is incomplete to the downside & should see more weakness in 3 or 7 swings against 10.26.2022 peak. So, we advised members to sell the bounces in 3, 7, or 11 swings at the blue box area. We will explain the structure & forecast below:
$META 1H Elliottwave Chart 11.15.2022:
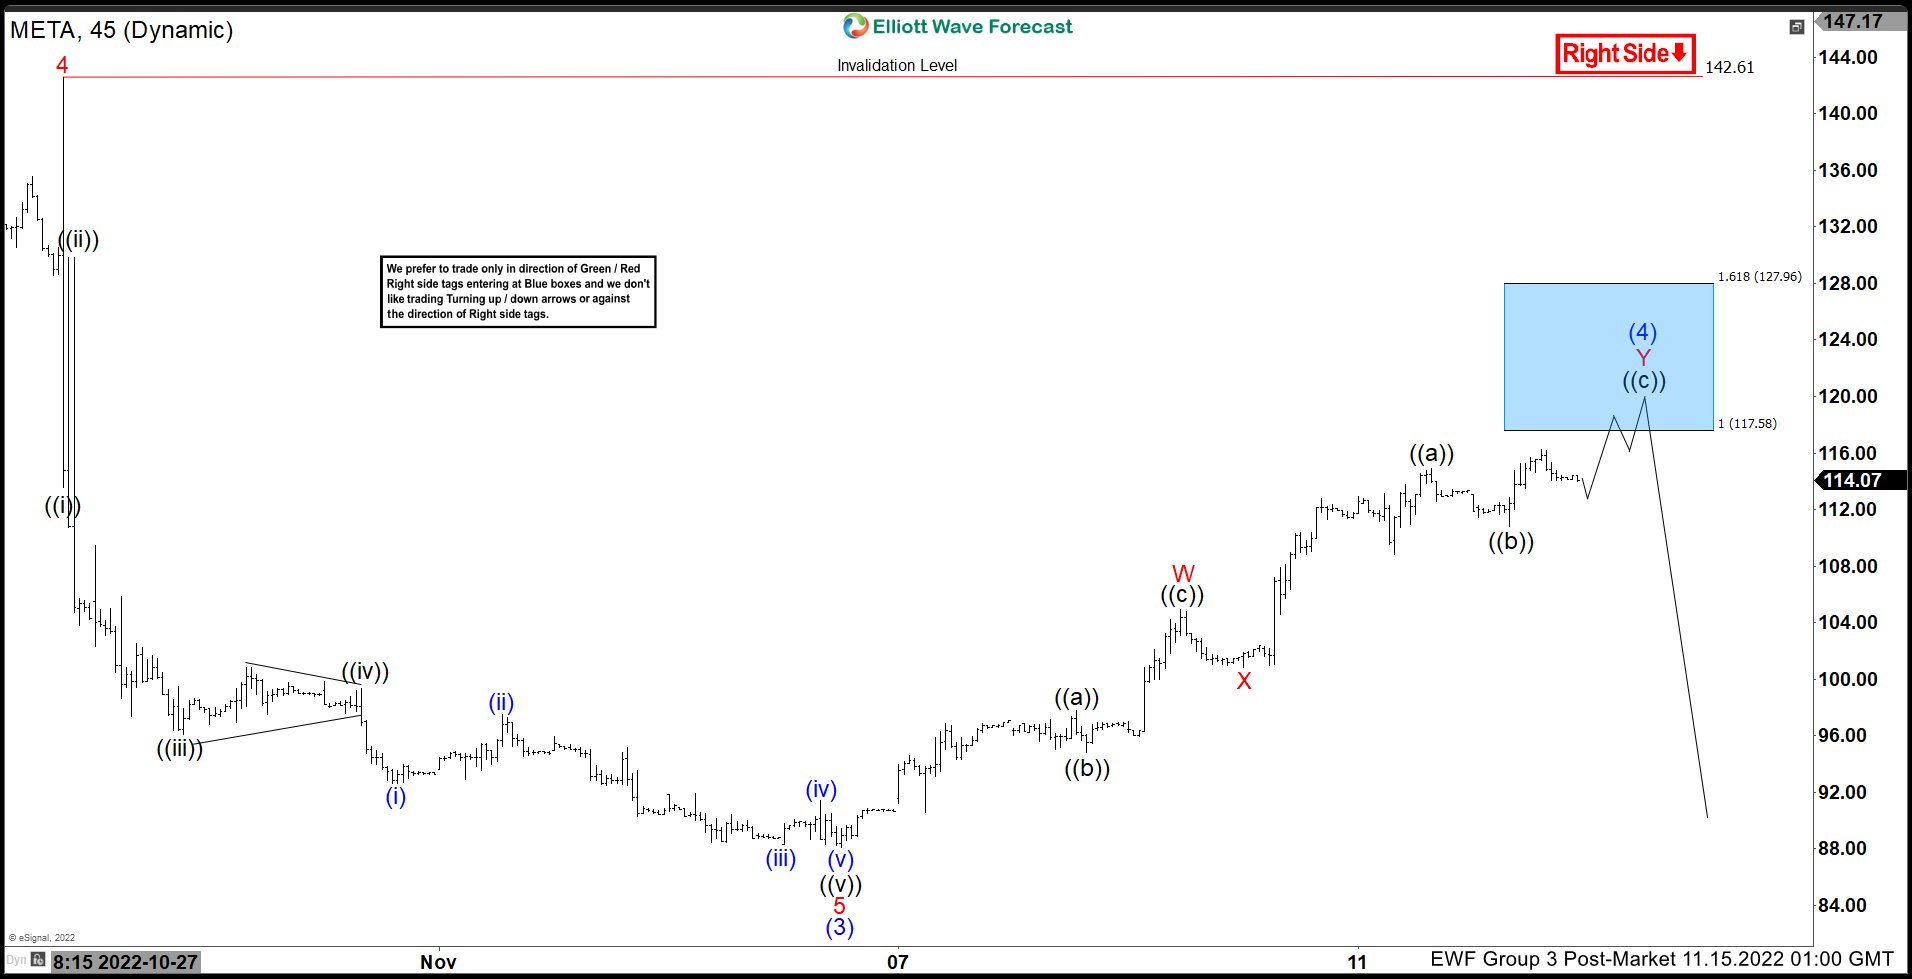
Here is the 1H Elliottwave count from 11.15.2022. The decline from 10.26.2022 unfolded in 5 waves breaking below 10.13.2022 low creating a bearish sequence. We were calling for the bounce to fail in 7 swings at red Y of (4) where we like to sell it at the equal legs at $117.58 with a stop at $127.96.
$META Latest 1H Elliottwave Chart:
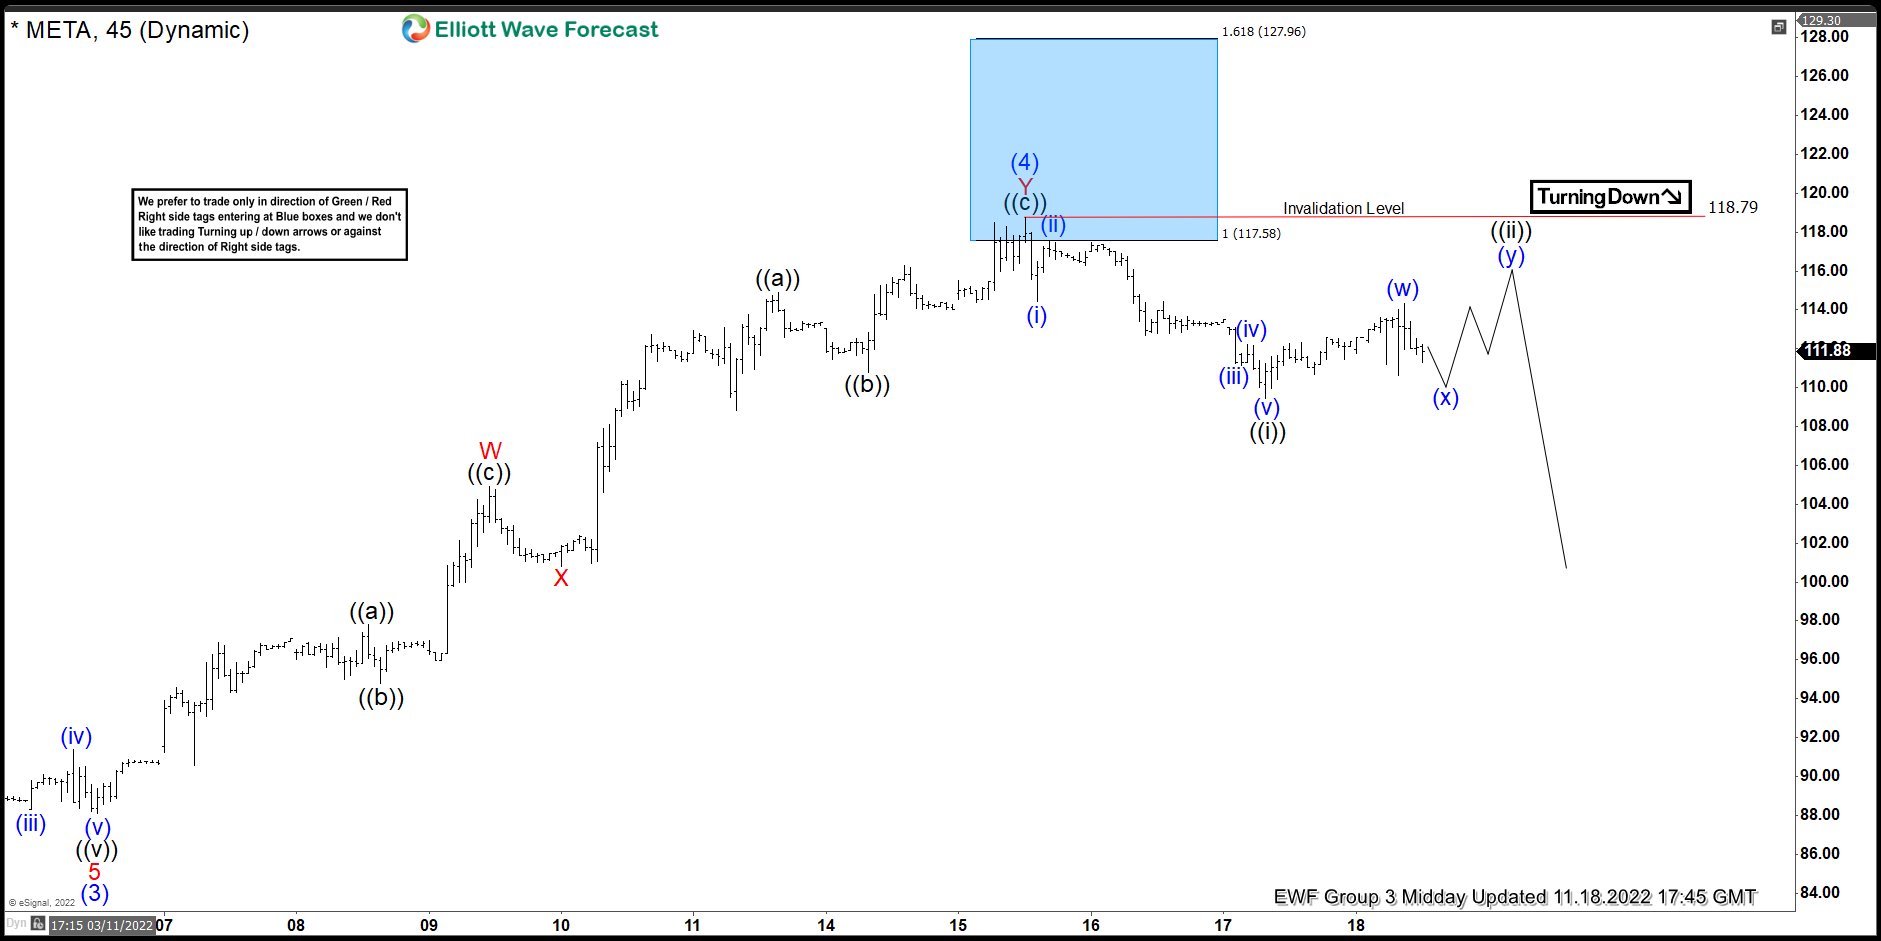
Here is the 11.18.2022 1H update showing the move taking place as expected. The stock has reacted lower from the blue box to reach the 50% back from red X allowing any shorts to get risk free shortly after taking the position.



Comments
Log in or sign up to join the conversation.