

How much has the price per square foot of the typical new home sold in the U.S. changed over the last 10 years?
The following chart visualizes the answer to that question for each month from July 2016 through July 2026, both adjusted for inflation and in nominal, noninflation adjusted terms.
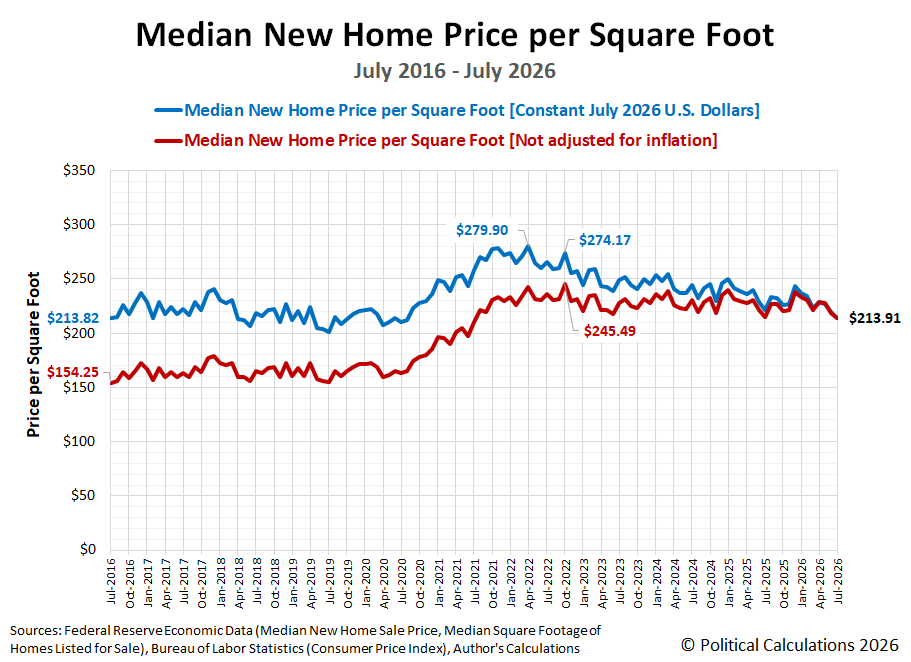
Perhaps the most surprising takeaway observation from the chart is that the median sale price per square foot of $213.91 for a new home sold in July 2026 is just nine cents per square foot more than it was in July 2016 after adjusting for inflation to be in terms of constant July 2026 U.S. dollars.
Not adjusting for inflation, the median new home cost per square foot in July 2026 is about 39% higher than it was ten years earlier.
The inflation adjusted peak median new home price per square foot came in April 2022, shortly before the U.S. Federal Reserve finally got around to hiking U.S. interest rates to combat the high inflation unleashed by the Biden Administration. Adjusting for inflation, that peak was $279.90 per square foot. The nominal peak was $245.49 per square foot in October 2022.
References
Federal Reserve Economic Data. Housing Inventory: Median Home Size in Square Feet in the United States, July 2016-August 2026. [Online Database]. 4 September 2026.
Federal Reserve Economic Data. Median Sales Price of New Houses Sold for the United States. [Online Database]. 25 August 2026.
U.S. Bureau of Labor Statistics. Consumer Price Index for All Urban Consumers: All Items in U.S. City Average. [Online Database]. 11 September 2026.


Comments
Log in or sign up to join the conversation.