

Motio Research's initial estimate of U.S. median household income for September 2026 is $87,850, an apparent $340 (or 0.4%) decrease from the firm's initial estimate of $88,190 for August 2026.
We're describing the month-over-month change as "apparent" because Motio Research recalibrated its historical monthly median household income estimates. Here's their note of caution against direct comparison with their previous monthly estimates:
The September update incorporates annual Census rebenchmarking of Motio's public dollar estimates, using the official 2025 median household income of $87,460. The recalibration changes published dollar levels but not their growth rates or the separate historical Momentum series. Previously published dollar estimates should not be compared directly with the recalibrated levels.
Motio Research's recalibration of their nominal median household income estimates is substantial, affecting all their estimates extending back to January 2010. From January 2010 through January 2020 and from December 2020 through July 2025, most changes are small, with the recalibrated estimates within one percent of Motio's previously reported figures. The period from February 2020 through November 2020, which covers the period during 2020's Coronavirus Pandemic when the Census Bureau wasn't able to fully survey the income of lower income-earning U.S. households, saw somewhat larger changes though the recalibrated estimates are still skewed upward because of the undercollection of survey data on which they're based.
Motio Research's monthly median household estimates from August 2025 through August 2026 saw large downward adjustments, lowering the estimates anywhere from one to two percent from pre-recalibration reported levels. Previously, we observed Motio Research's estimates during this period were running "hot" with respect our estimates. We had hypothesized that difference might be attributable in part to the Trump administration's program to pay cash awards and also for the travel of millions of illegal aliens who volunteered to return to their home countries as they took advantage of the program, since it would be most attractive to the lowest-income earning households within this category and fit the timing of a surge in Motio Research's median household income data. The recalibrated data suggests the impact of that program has had a much smaller effect on median household income than it had appeared from the previously reported estimates.
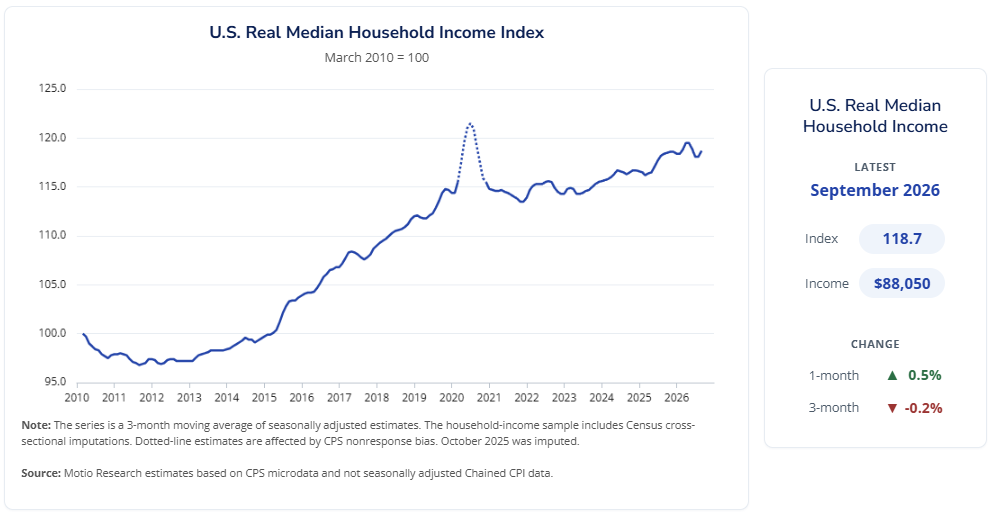
The following screenshots of Motio Research's interactive charts visualize the latest trends in the U.S.' median household income. The first chart presents the firm's Household Income Index, which is based on three-month moving average that sets the period of January 2010 through March 2010 at a value of 100 after making adjustments for inflation and seasonality in the data. The second chart presents their monthly median household income estimates in nominal (not adjusted for inflation) terms for the period from January 2010 through September 2026.
Monthly Household Income Index
Median Household Income Estimates
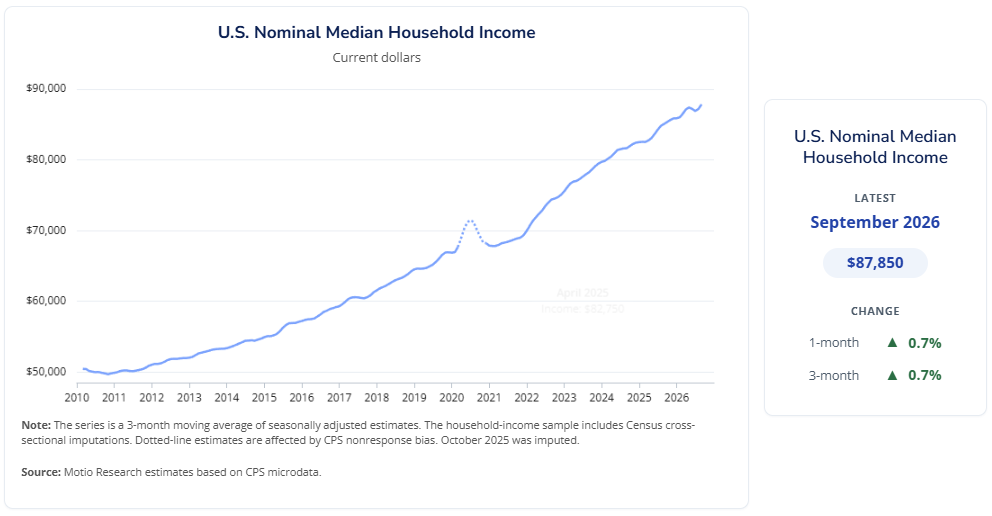
Looking at the recalibrated nominal data, median household income increased by $650 (or 0.75%) from August 2026's recalibrated $87,200 to September 2026's $87,850, which is a significant month-over-month change.
Analyst's Notes
Political Calculations produces monthly median household income estimates using an alternate methodology that complements Motio Research's survey-based estimates. In September 2026, Political Calculations' initial estimate of median household income is $88,076. This estimate is $498 (or 0.56%) lower than our initial estimate of $88,574 for August 2026's median household income.
The following chart presents our latest estimates of U.S. median household income, both adjusted for inflation (blue) and not-adjusted for inflation (red) for each month from January 2000 through September 2026.
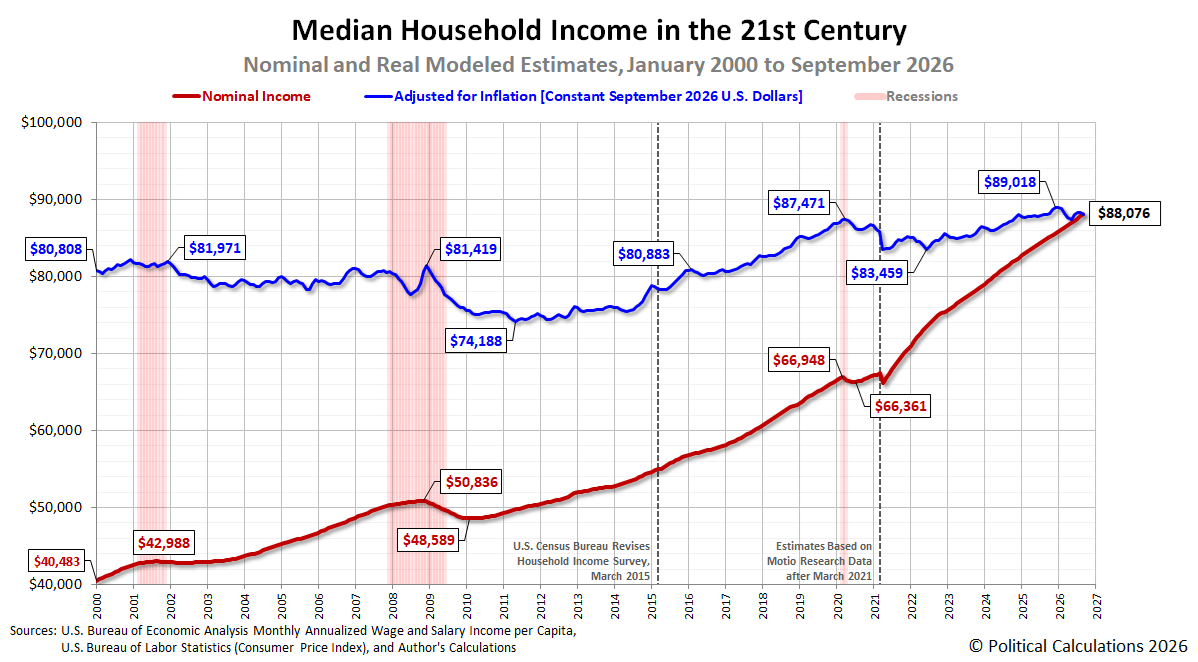
Political Calculations' September 2026 estimate is $226 (0.3%) higher than Motio Research's estimate of $87,850. It is also $5,338 higher than our revised non-inflation adjusted estimate of $82,378 for median household income in January 2025, or $320 higher than the inflation-adjusted estimate of $87,757. The increase in inflation since February 2026 has eroded real median household income in the months since, though not so much that the typical American household is still better off than they were at the end of the Biden-Harris administration's tenure in office.
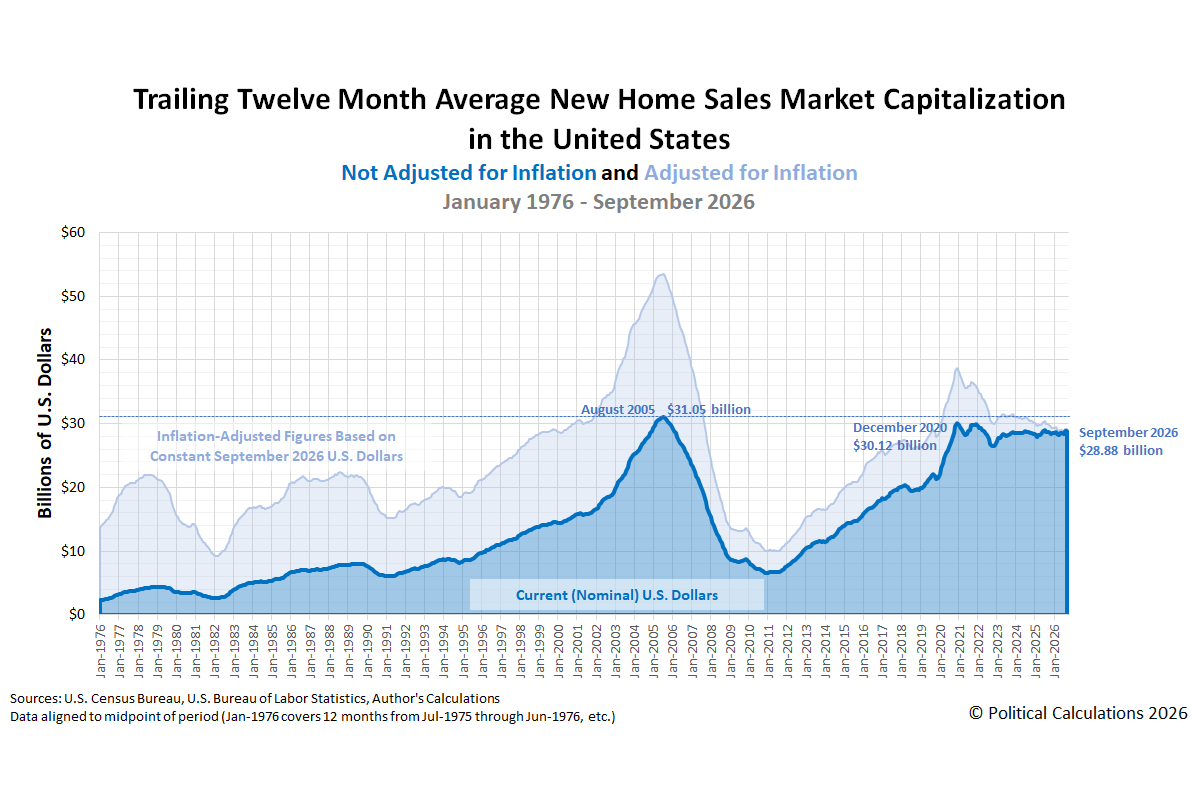
That matters because it plays into how affordable it is for a household at the exact middle of the nation's spectrum of income to live in the U.S. On that count, here's a special bonus preview of a chart we'll discuss later this week that focuses on the biggest single expense most households have and how its relative affordability has changed since January 2000 (and also since January 2025).
References
U.S. Bureau of Economic Analysis. Table 2.6. Personal Income and Its Disposition, Monthly, Personal Income and Outlays, Not Seasonally Adjusted, Monthly, Middle of Month. Population. [Online Database (via Federal Reserve Economic Data)]. Last Updated: 29 October 2026. Accessed: 29 October 2026.
U.S. Bureau of Economic Analysis. Table 2.6. Personal Income and Its Disposition, Monthly, Personal Income and Outlays, Not Seasonally Adjusted, Monthly, Middle of Month. Compensation of Employees, Received: Wage and Salary Disbursements. [Online Database (via Federal Reserve Economic Data)]. Last Updated: 29 October 2026. Accessed: 29 October 2026.
Comments
Log in or sign up to join the conversation.