

A CNN headline notes “A key inflation measure rose at fastest pace in 30 years in July”, with that key inflation measure being the year-on-year (y/y) personal consumption expenditure (PCE) inflation. In point of fact, that headline was actually incorrect as annualized m/m inflation was actually slightly higher in June. But in any case, by focusing on the y/y rate, they missed the main message In today’s release — that month-on-month (m/m) annualized PCE inflation was down sharply, from 6.6% to 5.1%. Moreover, the core counterpart was also down, from 5.8% to 4.1% (0.3% m/m hitting the Bloomberg consensus on the nose.)
This personal income and expenditures release rounds out the inflation measures for July. Updating the graphs from this August 11th post, we have the following.

Figure 1: Month-on-month annualized inflation from CPI-all urban (blue), from personal consumption expenditure (PCE) deflator (black), chained CPI (brown), sticky price CPI (green), and 16% trimmed mean CPI (red). Chained CPI inflation seasonally adjusted by author. Source: BLS, Atlanta Fed, Cleveland Fed, via FRED, and author’s calculations.
The general discussion stressing y/y changes is understandable, but frustrating as it really tells almost as much about the past as the present, in the current context.
What about core measures? The core CPI inflation rate was also sharply down, as shown in Figure 2 (no trimmed core shown).

Figure 2: Month-on-month annualized inflation from CPI-all urban (blue), from personal consumption expenditure (PCE) deflator (black), chained CPI (brown), and sticky price CPI (green). Chained CPI inflation seasonally adjusted by author. Source: BLS, Atlanta Fed, Cleveland Fed, via FRED, NBER, and author’s calculations.
Looking to components of the PCE deflator, every inflation category was down relative to June, except for energy goods and services (rising from 1.5% to 1.6% m/m), and nondurable goods and services, both of which remained constant.
In other words, to repeat the conclusion to my August 14th post, every easily measurable aggregate indicator — CPI, PCE deflator — of m/m inflation is down.
The 5 year inflation breakeven rose by 3 bps. Nonetheless, the breakeven is still lower than after the July CPI release (and one has to remember that the unadjusted breakeven is a distorted measure of expected inflation, due to inflation and liquidity premia, as discussed in this post).
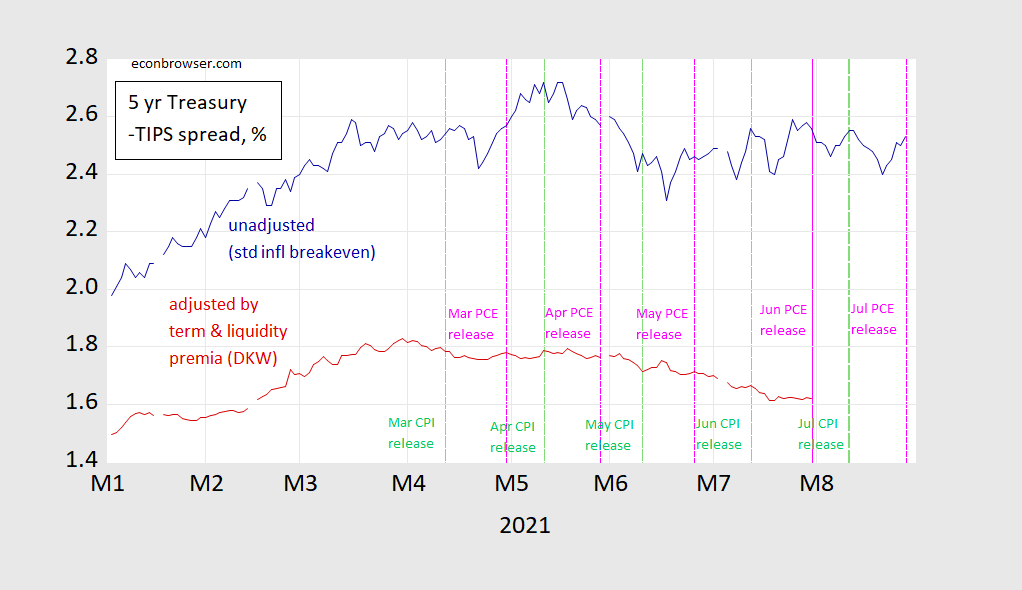
Figure 3: Five year inflation breakeven calculated as five year Treasury yield minus five year TIPS yield (blue), five year breakeven adjusted by inflation risk premium and liquidity premium per DKW, all in %. Source: FRB via FRED, Treasury, KWW following D’amico, Kim and Wei (DKW) accessed 8/6, and author’s calculations.
Update, 5pm Pacific:
Goldman Sachs shows their trimmed core PCE deflator inflation measure, and forecasts.

Source: Hatzius, Struyven, Bhushan, “Global Economics Comment: July Trimmed Core Inflation: Flat at 1.8% YoY in the US; Sequential Acceleration in UK and Canada,” Goldman Sachs, 27 August 2021.



Comments
Log in or sign up to join the conversation.