

In May housing permits (blue in the graph below), including the least volatile single-family permits (red, right scale), continued to decline from their January peak. Meanwhile, the more volatile and slightly lagging housing starts (green) increased, but remained below their March peak:
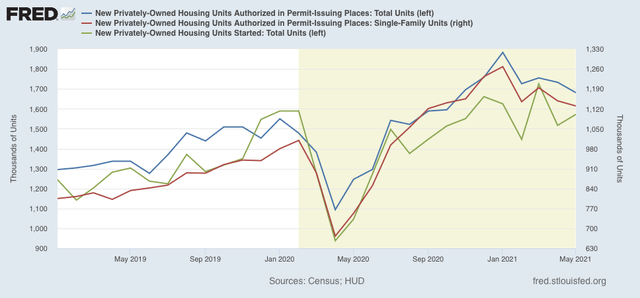
The level of construction activity as high as or higher than its pre-pandemic peak is continuing. On the other hand, with a 10% decline in permits, and 9% in starts, the minimum decline to be consistent with a possible upcoming recession has nearly been met (while a 20% decline is more typical). For now, I interpret this to mean a sign of a slowing down of economic growth next year.
Finally, here is the YoY change in mortgage rates (red), inverted so that up = economic positive, and down = economic negative, compared with total permits (blue)/10 for scale:
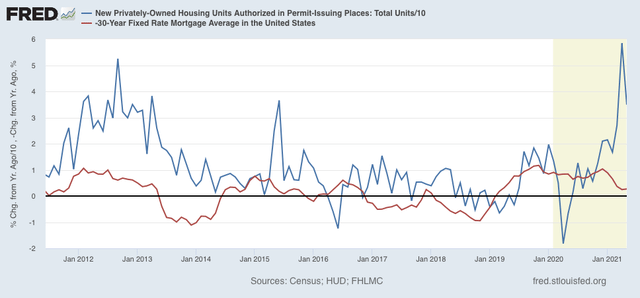
As I have said many times before, mortgage rates lead permits and starts. The artifact of comparisons with the pandemic lockdown months will end next month, at which time I expect permits to be much more in line with their historical relationship with interest rates than they have been in the past few months.


Comments
Log in or sign up to join the conversation.