


Of the five Federal Reserve districts which have released their May manufacturing surveys - all were in expansion. A complete summary follows.
Analyst Opinion of Dallas Fed Manufacturing Survey
This survey remains in positive territory with new orders significantly improving and unfilled orders modestly improving - but both in positive territory. This was a stronger report than last month.
The expectations from Bloomberg / Econoday was 20.0 to 27.0 (consensus 23.3), and the reported value was 35.2. From the Dallas Fed:
Texas factory activity rose markedly in May, according to business executives responding to the Texas Manufacturing Outlook Survey. The production index, a key measure of state manufacturing conditions, increased 10 points to a 12-year high of 35.2, signaling further acceleration in output growth.
Most other indexes of manufacturing activity also indicated a sharp acceleration in May. The capacity utilization index rose notably from 18.7 to 32.2, and the shipments index jumped 20 points to 39.5. Demand growth picked up as the growth rate of orders index increased eight points to 26.5. All three measures reached their highest readings since 2006. Meanwhile, the new orders index held steady at 27.7.
Perceptions of broader business conditions were even more positive in May than in April. The general business activity index rose five points to 26.8, and the company outlook index rose four points to 28.0. These readings are far above their respective averages.
Labor market measures suggested stronger growth in employment and notably longer work hours in May. The employment index pushed up six points to 23.4, its highest reading in six years. Twenty-nine percent of firms noted net hiring, compared with 5 percent that noted net layoffs. The hours worked index shot up nine points to 23.2.
Price and wage pressures remained highly elevated in May. The raw materials prices index and wages and benefits index edged down to 44.0 and 24.3, respectively—still well above their average readings. The finished goods prices index moved up to 20.5, with a quarter of firms noting that prices rose this month.
Expectations regarding future business conditions remained largely optimistic in May. The indexes of future general business activity and future company outlook were largely unchanged at 30.0 and 35.2, respectively, with both readings significantly above average. Most other indexes for future manufacturing activity pushed further into positive territory.
| Business Indicators Relating to Facilities and Products in Texas Current (versus previous month) |
|||||
| Indicator | May Index | Apr Index | Change | Indicator Direction* | Trend** (Months) |
|
Production |
35.2 |
25.3 |
+9.9 |
Increasing |
23 |
|
Capacity Utilization |
32.2 |
18.7 |
+13.5 |
Increasing |
23 |
|
New Orders |
27.7 |
27.9 |
-0.2 |
Increasing |
19 |
|
Growth Rate of Orders |
26.5 |
18.9 |
+7.6 |
Increasing |
17 |
|
Unfilled Orders |
4.1 |
7.2 |
-3.1 |
Increasing |
14 |
|
Shipments |
39.5 |
19.3 |
+20.2 |
Increasing |
18 |
|
Delivery Time |
10.2 |
14.5 |
-4.3 |
Increasing |
11 |
|
Finished Goods Inventories |
-6.6 |
1.7 |
-8.3 |
Decreasing |
1 |
|
Prices Paid for Raw Materials |
44.0 |
46.3 |
-2.3 |
Increasing |
27 |
|
Prices Received for Finished Goods |
20.5 |
17.0 |
+3.5 |
Increasing |
22 |
|
Wages and Benefits |
24.3 |
29.3 |
-5.0 |
Increasing |
106 |
|
Employment |
23.4 |
17.8 |
+5.6 |
Increasing |
17 |
|
Hours Worked |
23.2 |
14.3 |
+8.9 |
Increasing |
19 |
|
Capital Expenditures |
21.7 |
23.9 |
-2.2 |
Increasing |
21 |
Source: Dallas Fed
Summary of all Federal Reserve Districts Manufacturing:
Richmond Fed (hyperlink to reports):
(Click on image to enlarge)

z richmond_man.PNG
Kansas Fed (hyperlink to reports):
(Click on image to enlarge)

z kansas_man.PNG
Dallas Fed (hyperlink to reports):
(Click on image to enlarge)

z dallas_man.PNG
Philly Fed (hyperlink to reports):
(Click on image to enlarge)

z philly fed1.PNG
New York Fed (hyperlink to reports):
(Click on image to enlarge)

z empire1.PNG
Federal Reserve Industrial Production - Actual Data (hyperlink to report):
(Click on image to enlarge)
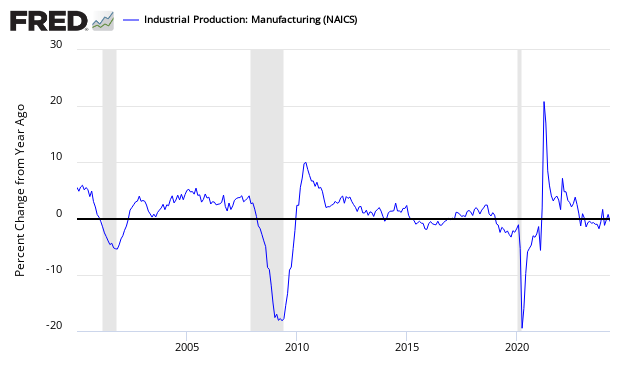
Holding this and other survey's Econintersect follows accountable for their predictions, the following graph compares the hard data from Industrial Products manufacturing subindex (dark blue bar) and US Census manufacturing shipments (lighter blue bar) to the Dallas Fed survey (light blue bar).
Comparing Surveys to Hard Data:
(Click on image to enlarge)

z survey1.png
In the above graphic, hard data is the long bars, and surveys are the short bars. The arrows on the left side are the key to growth or contraction.


Comments
Log in or sign up to join the conversation.