
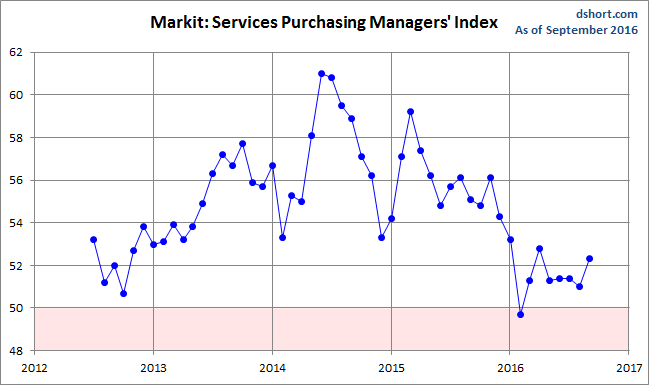
The final September US Services Purchasing Managers' Index conducted by Markit came in at 52.3 percent, up 1.3 percent from the final July estimate. The Investing.com consensus was for 51.9 percent (the September Markit preliminary reading). Markit's Services PMI is a diffusion index: A reading above 50 indicates expansion in the sector; below 50 indicates contraction.
Here is the opening from the latest press release:
U.S. service providers indicated an upturn in business activity growth from the six-month low recorded during August. Nonetheless, the pace of expansion remained modest and softer than its post-crisis trend, largely reflecting subdued new business gains in recent months. [Press Release]
Here is a snapshot of the series since mid-2012.
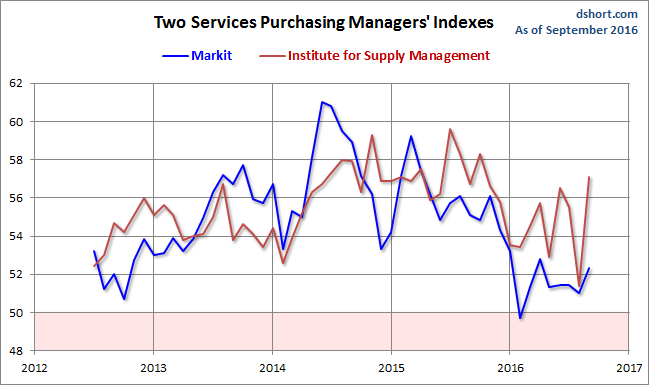
Here is an overlay with the equivalent PMI survey conducted by the Institute for Supply Management, which they refer to as "Non-Manufacturing" (see our full article on this series here). Over the past year, the ISM metric has been significantly the more volatile of the two.
The next chart uses a three-month moving average of the two rather volatile series to facilitate our understanding of the current trend. Since early in 2016, the ISM metric has shown stronger growth than the Markit counterpart. It will be interesting to see how these two indicators play out over the next few months.
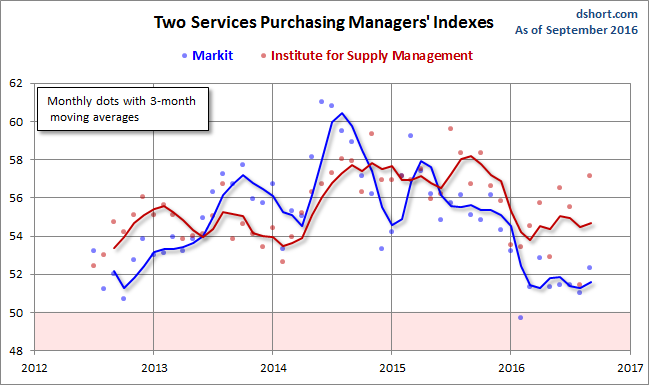
Both series have weakened over the past several months. The interim three-month moving average of the Markit Services index peaked in August of 2014. The ISM index peaked in September of 2015. The two were fairly closely aligned at the beginning of this year, but they have diverged in recent months with the Markit index signaling noticeably weaker growth.


Comments
Log in or sign up to join the conversation.