
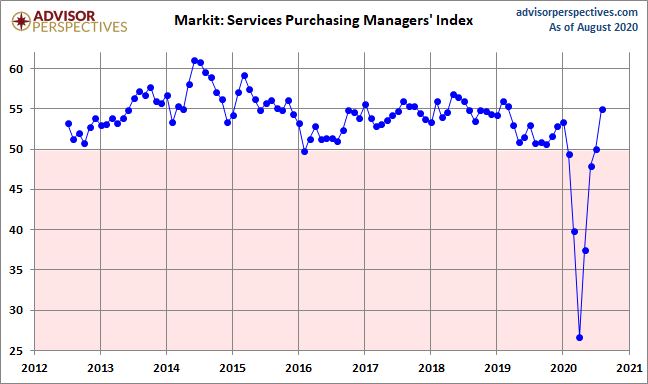
The August US Services Purchasing Managers' Index conducted by Markit came in at 55.0 percent, up 5.0 from the final July estimate of 50.0. The Investing.com consensus was for 54.8 percent.
Here is the opening from the latest press release:
Commenting on the latest survey results, Chris Williamson, Chief Business Economist at IHS Markit, said:
“Surging inflows of new business helped propel service sector activity higher in August, with the sector growing at its fastest rate for almost one and a half years. Firms were often left struggling to meet demand and, despite taking on extra staff at a pace not seen for over six years, backlogs of uncompleted work accumulated at a rate exceeding anything recorded since 2009. The increase in backlogs of work bodes well for robust output growth to persist into September.
“Combined with the stronger picture emerging from manufacturing in August, the improved performance of the vast service sector adds to signs that the third quarter will see an impressive rebound in the economy from the collapse seen in the second quarter.
“However, the survey also highlights how the rebound is very uneven and the recovery path remains highly uncertain.
“August’s growth was driven by financial and business services as well as tech firms, but consumer-facing sectors such as travel, tourism and recreation remained firmly in decline due to the need for ongoing social distancing.
“Companies across the board also remain concerned about resurgent virus infections and the durability of demand in the coming months after the initial rebound potentially fades, with uncertainty over the Presidential election adding further risks to the outlook for many companies.” [Press Release]
Here is a snapshot of the series since mid-2012.
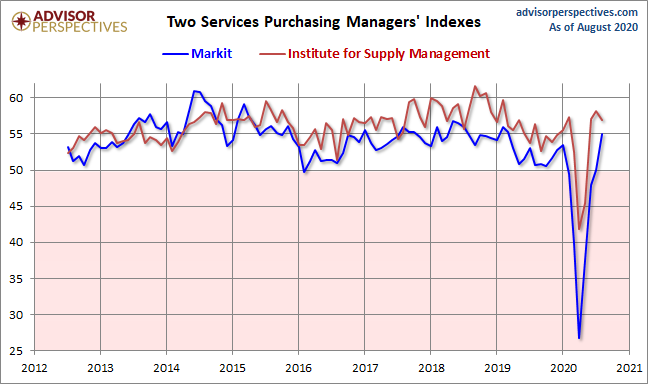
Here is an overlay with the equivalent PMI survey conducted by the Institute for Supply Management, which they refer to as "Non-Manufacturing" (see our full article on this series here). Over its history, the ISM metric has been significantly the more volatile of the two.
The next chart uses a three-month moving average of the two rather volatile series to facilitate our understanding of the current trend. Since early in 2016, the ISM metric has shown stronger growth than the Markit counterpart.
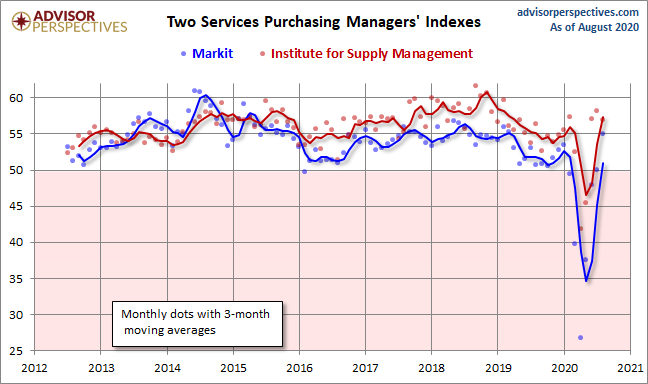
Both series weakened since 2015 and saw an uptick in the latter half of 2016. The interim three-month moving average of the Markit Services index peaked in August of 2014. The ISM index peaked in September of 2015. The two were fairly closely aligned at the beginning of 2016, but they diverged early with the Markit index signaling noticeably weaker growth.


Comments
Log in or sign up to join the conversation.