
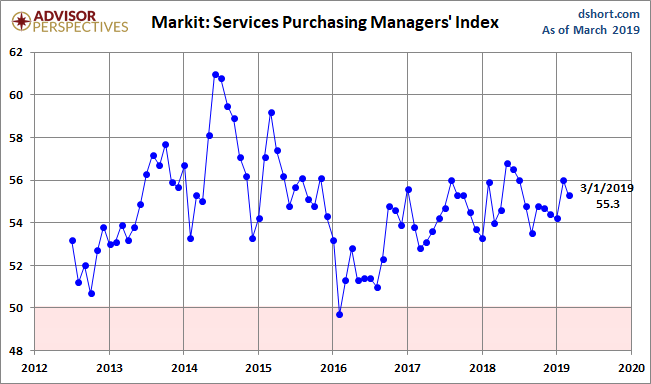
The March US Services Purchasing Managers' Index conducted by Markit came in at 55.3 percent, down 0.7 from the final February estimate of 56.0. The Investing.com consensus was for 54.8 percent. Markit's Services PMI is a diffusion index: A reading above 50 indicates expansion in the sector; below 50 indicates contraction.
Here is the opening from the latest press release:
Commenting on the PMI data, Chris Williamson, Chief Business Economist at IHS Markit said:
“Another solid service sector performance helped offset a deteriorating trend in manufacturing to leave the PMI surveys indicative of robust economic growth in March. For the first quarter as a whole, the surveys are consistent with the economy growing at an annualized rate of approximately 2.5%, painting a relatively rosy picture compared to official data, which so far suggest GDP could come in slightly weaker." [Press Release]
Here is a snapshot of the series since mid-2012.
(Click on image to enlarge)
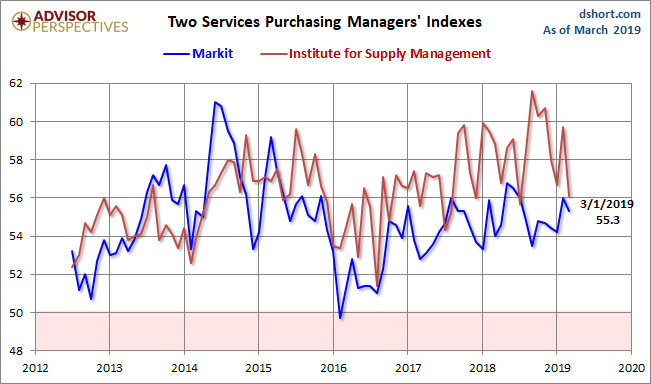
Here is an overlay with the equivalent PMI survey conducted by the Institute for Supply Management, which they refer to as "Non-Manufacturing" (see our full article on this series here). Over the past year, the ISM metric has been significantly the more volatile of the two.
(Click on image to enlarge)
The next chart uses a three-month moving average of the two rather volatile series to facilitate our understanding of the current trend. Since early in 2016, the ISM metric has shown stronger growth than the Markit counterpart.
(Click on image to enlarge)
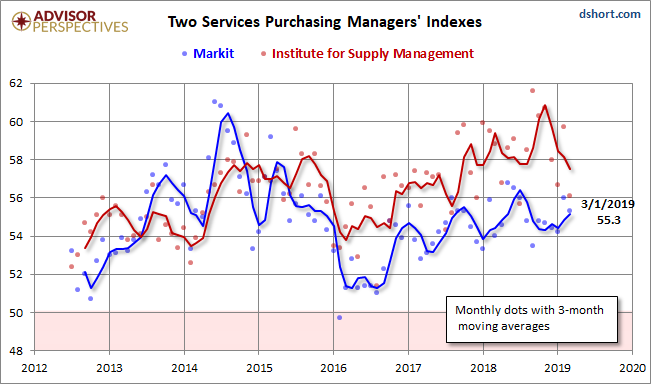
Both series weakened since 2015 and saw an uptick in the latter half of 2016. The interim three-month moving average of the Markit Services index peaked in August of 2014. The ISM index peaked in September of 2015. The two were fairly closely aligned at the beginning of 2016, but they diverged early with the Markit index signaling noticeably weaker growth.


Comments
Log in or sign up to join the conversation.