
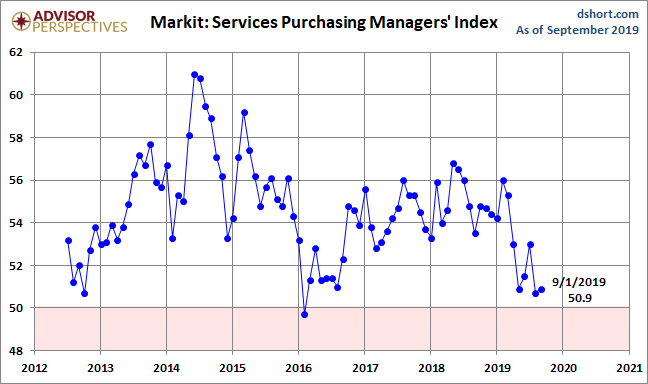
The August US Services Purchasing Managers' Index conducted by Markit came in at 50.9 percent, up 0.2 from the final August estimate of 50.7. The Investing.com consensus was for 50.9 percent. Markit's Services PMI is a diffusion index: A reading above 50 indicates expansion in the sector; below 50 indicates contraction.
Here is the opening from the latest press release:
Commenting on the PMI data, Chris Williamson, Chief Business Economist at IHS Markit said:
“A disappointing service sector PMI follows news of lacklustre manufacturing and means the past two months have seen one of the weakest backto-back expansions of business activity since 2009, sending a signal of slower GDP growth in the third quarter. The surveys are consistent with the economy growing at a 1.5% annualised rate in the third quarter, with forward-looking indicators suggesting further momentum could be lost in the fourth quarter. In particular, inflows of new business have almost stalled, with September seeing the smallest increase since 2009, and business expectations about the year ahead remain stuck at one of the gloomiest levels since at least 2012.
“In this environment, companies are taking an increasingly cost-conscious approach to payrolls, with September consequently seeing surveyed firms report a net drop in headcounts for the first time since 2010. This translates into non-farm payroll growth trending below 100,000.
“Price pressures have also abated in line with the weak demand picture, suggesting official inflation gauges could likewise moderate in coming months.” [Press Release]
Here is a snapshot of the series since mid-2012.
(Click on image to enlarge)
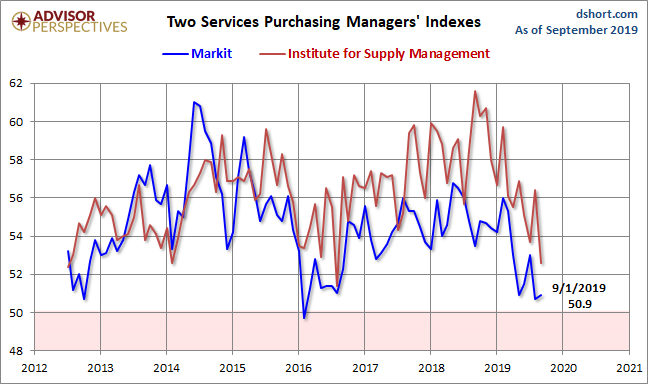
Here is an overlay with the equivalent PMI survey conducted by the Institute for Supply Management, which they refer to as "Non-Manufacturing" (see our full article on this series here). Over the past year, the ISM metric has been significantly the more volatile of the two.
(Click on image to enlarge)
The next chart uses a three-month moving average of the two rather volatile series to facilitate our understanding of the current trend. Since early in 2016, the ISM metric has shown stronger growth than the Markit counterpart.
(Click on image to enlarge)
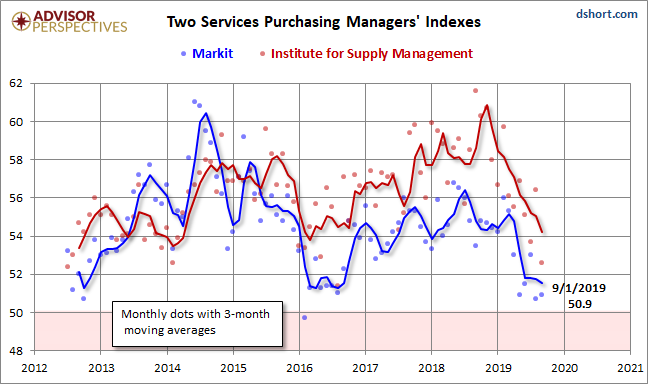
Both series weakened since 2015 and saw an uptick in the latter half of 2016. The interim three-month moving average of the Markit Services index peaked in August of 2014. The ISM index peaked in September of 2015. The two were fairly closely aligned at the beginning of 2016, but they diverged early with the Markit index signaling noticeably weaker growth.


Comments
Log in or sign up to join the conversation.