
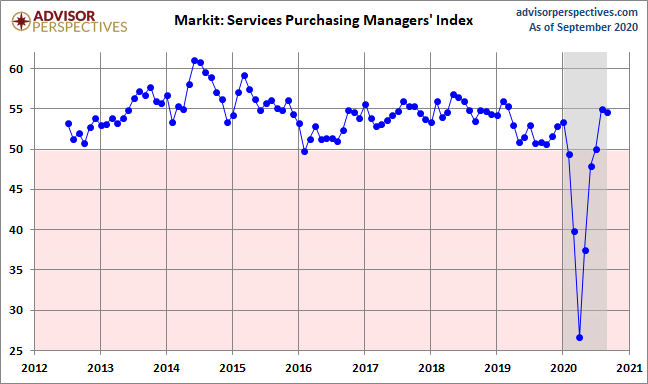
The September US Services Purchasing Managers' Index conducted by Markit came in at 54.6 percent, down 0.4 from the final August estimate of 55.0. The Investing.com consensus was for 54.6 percent.
Here is the opening from the latest press release:
Commenting on the latest survey results, Chris Williamson, Chief Business Economist at IHS Markit, said:
“The U.S. economy continued to rebound in September from the deep contraction seen at the height of the Covid-19 pandemic, with business activity rising across both manufacturing and services to round off the strongest quarter since early-2019.
“Covid-19 worries and social distancing continued to impact many businesses, however, especially in consumerfacing sectors, where demand for services fell once again. However, business and financial services, healthcare and housing sectors all fared well as the economy continued to revive, and exports of services also picked up as other countries continued to open up their economies.
“Encouragingly, new orders for services grew at an increased rate in September, putting additional pressure on operating capacity and fuelling another robust rise in employment. A further rise in backlogs of work bodes well for robust jobs growth to be sustained into October.
“Sentiment on prospects for the coming year darkened significantly, however, linked to growing worries about virus numbers, uncertainty regarding the presidential election and fears that the economy is susceptible to weakening unless more support measures are put in place soon.” [Press Release]
Here is a snapshot of the series since mid-2012.
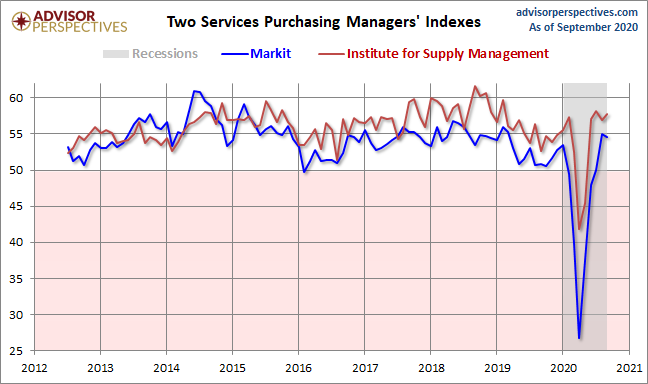
Here is an overlay with the equivalent PMI survey conducted by the Institute for Supply Management, which they refer to as "Non-Manufacturing" (see our full article on this series here). Over its history, the ISM metric has been significantly the more volatile of the two.
The next chart uses a three-month moving average of the two rather volatile series to facilitate our understanding of the current trend. Since early in 2016, the ISM metric has shown stronger growth than the Markit counterpart.
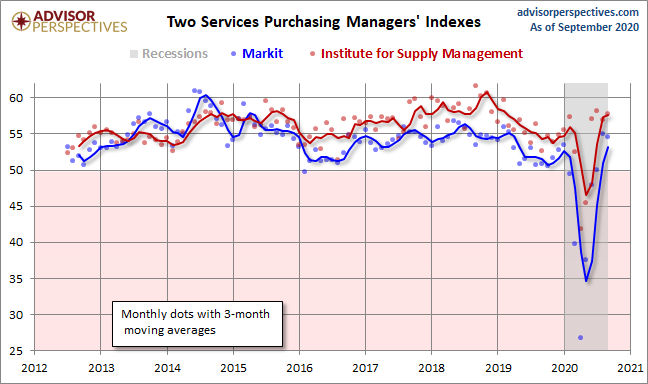
Both series weakened since 2015 and saw an uptick in the latter half of 2016. The interim three-month moving average of the Markit Services index peaked in August of 2014. The ISM index peaked in September of 2015. The two were fairly closely aligned at the beginning of 2016, but they diverged early with the Markit index signaling noticeably weaker growth.


Comments
Log in or sign up to join the conversation.