
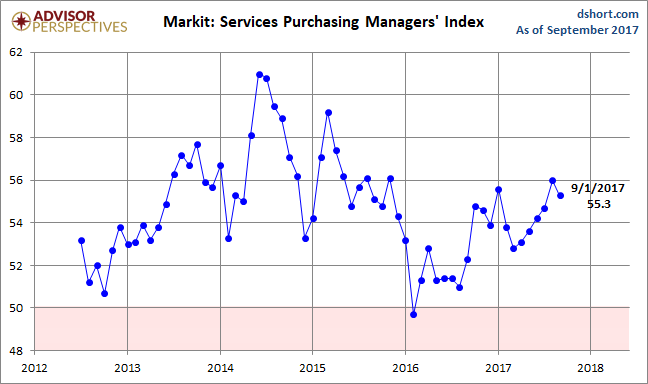
The September US Services Purchasing Managers' Index conducted by Markit came in at 55.3 percent, down 0.7 from the August estimate. The Investing.com consensus was for 55.1 percent. Markit's Services PMI is a diffusion index: A reading above 50 indicates expansion in the sector; below 50 indicates contraction.
Here is the opening from the latest press release:
September survey data signalled a further rise in business activity across the US service sector. Although the rate of growth eased slightly compared with August, upturns in both activity and inflows of new work were strong compared to the average seen over the past two years. Sustained growth of output and new orders supported solid increases in staffing levels. Additional payroll numbers helped to alleviate capacity pressures.
Meanwhile, inflationary pressures continued to intensify. Input price inflation was the fastest since June 2015, and charge inflation accelerated to the quickest in three years.
The seasonally adjusted IHS Markit U.S. Services Business Activity Index registered 55.3 in September, down slightly from 56.0 in August. This indicated a strong end to the third quarter, and the fastest average quarterly growth so far this year. A number of survey respondents linked the rise in business activity to strong client demand in domestic markets. [Press Release]
Here is a snapshot of the series since mid-2012.
(Click on image to enlarge)
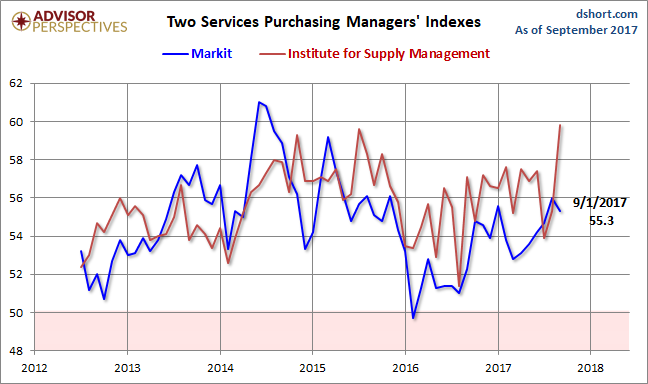
Here is an overlay with the equivalent PMI survey conducted by the Institute for Supply Management, which they refer to as "Non-Manufacturing" (see our full article on this series here). Over the past year, the ISM metric has been significantly the more volatile of the two.
(Click on image to enlarge)
The next chart uses a three-month moving average of the two rather volatile series to facilitate our understanding of the current trend. Since early in 2016, the ISM metric has shown stronger growth than the Markit counterpart. It will be interesting to see how these two indicators play out for the remainder of 2017.
(Click on image to enlarge)
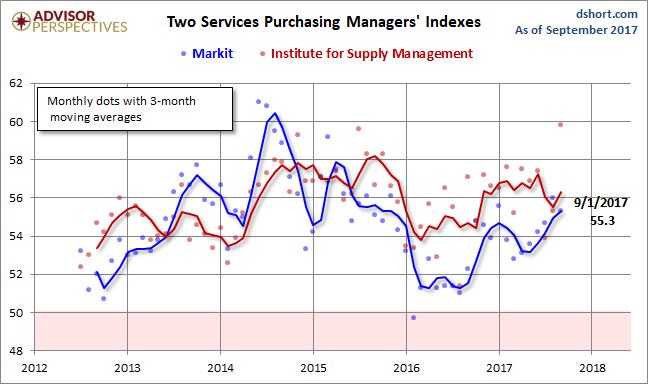
Both series weakened since 2015 and saw an uptick in the latter half of 2016. The interim three-month moving average of the Markit Services index peaked in August of 2014. The ISM index peaked in September of 2015. The two were fairly closely aligned at the beginning of 2016, but they diverged early with the Markit index signaling noticeably weaker growth.


Comments
Log in or sign up to join the conversation.