
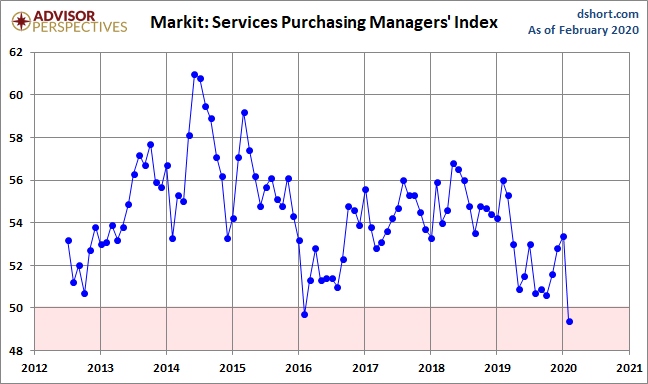
The February US Services Purchasing Managers' Index conducted by Markit came in at 49.4 percent, down 4.0 from the final January estimate of 53.4. The Investing.com consensus was for 49.4 percent.
Here is the opening from the latest press release:
Commenting on the latest survey results, Chris Williamson, Chief Business Economist at IHS Markit, said:
"The US service sector took a knock from the coronavirus outbreak and growing uncertainty about the economic and political outlooks in February. The fall in the headline index measuring business activity levels was the second largest seen since the global financial crisis over a decade ago, exceeded only by the brief slump in activity during the 2013 government shutdown."
"Combined with a weak manufacturing survey in February, the data are consistent with annualised GDP growth slipping from around 2% at the start of the year to just 0.7% midway through the first quarter.
"Business sectors such as travel and tourism are reporting weakened activity due to the virus outbreak, most notably in terms of foreign visitors and overseas sales. However, other sectors such as financial services and business services are reporting virus-related hits to demand, suggesting a more broad-based weakening of demand across the economy, exacerbating the supply-shock that is constraining manufacturing."
"Companies have meanwhile grown increasingly concerned about client spending and investment being curbed ahead of the presidential election. Political and economic uncertainty, the coronavirus outbreak and financial market turmoil all risk building into a cocktail of risk aversion that has severely heightened downside risks to the economy in coming months. Much will depend of course on the speed with which the virus can be contained and how quickly business can return to normal." [Press Release]
Here is a snapshot of the series since mid-2012.
(Click on image to enlarge)
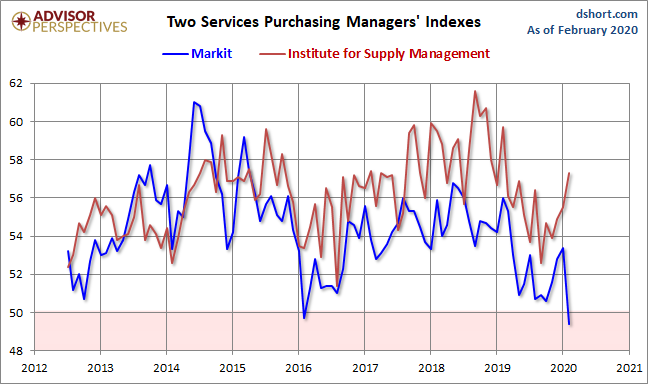
Here is an overlay with the equivalent PMI survey conducted by the Institute for Supply Management, which they refer to as "Non-Manufacturing" (see our full article on this series here). Over the past year, the ISM metric has been significantly the more volatile of the two.
(Click on image to enlarge)
The next chart uses a three-month moving average of the two rather volatile series to facilitate our understanding of the current trend. Since early in 2016, the ISM metric has shown stronger growth than the Markit counterpart.
(Click on image to enlarge)
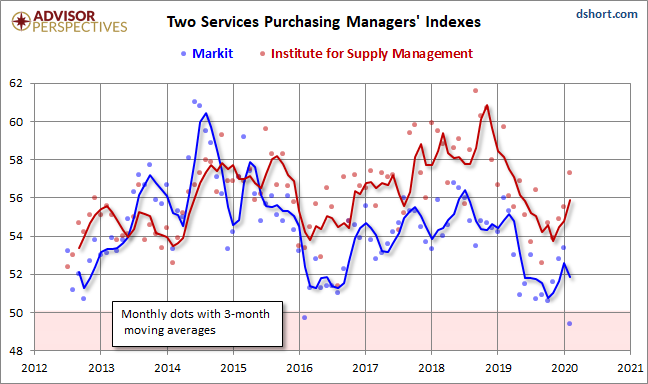
Both series weakened since 2015 and saw an uptick in the latter half of 2016. The interim three-month moving average of the Markit Services index peaked in August of 2014. The ISM index peaked in September of 2015. The two were fairly closely aligned at the beginning of 2016, but they diverged early with the Markit index signaling noticeably weaker growth.


Comments
Log in or sign up to join the conversation.